Market Outlook
Market Outlook
August 2026

| August 2026 |
|

|
The month of August 2026 was a mixed bag for global equities with renewed tension in the middle east offsetting strong corporate earnings momentum. Nifty 50 after ending
in positive for the past two months, ended with 1.2% negative returns despite healthy result season and positive Foreign Institutional Investors (FII) inflow amid concerns on
rising crude oil prices and higher inflation.
Asian markets ended in green for the month of August, barring Hang Seng. After a sharp sell-off in July, South Korea and Taiwan saw healthy recovery during the month with KOSPI and Taiwan Index up by 3.4% and 7% respectively. Japanese market NIKKEI 225 too was up by 3% driven by AI and semiconductor themes. Chinese index SSE Composite (Shanghai Stock Exchange) was up by 4% led by strong macro-economic data, while Hong Kong’s Hang Seng was down by 1.2% on account of rising global interest rates and softer economic data.
Performance of developed European economies was a mixed bag with German index DAX up by 2.5%, while FTSE 100 Index (UK) and French CAC 40 down by 0.4% and 2.1% respectively. US market was up for the month of August with S&P 500 and Dow Jones up by 2.6% and 1.3% respectively driven by strong earnings season and a resilient AI trade.
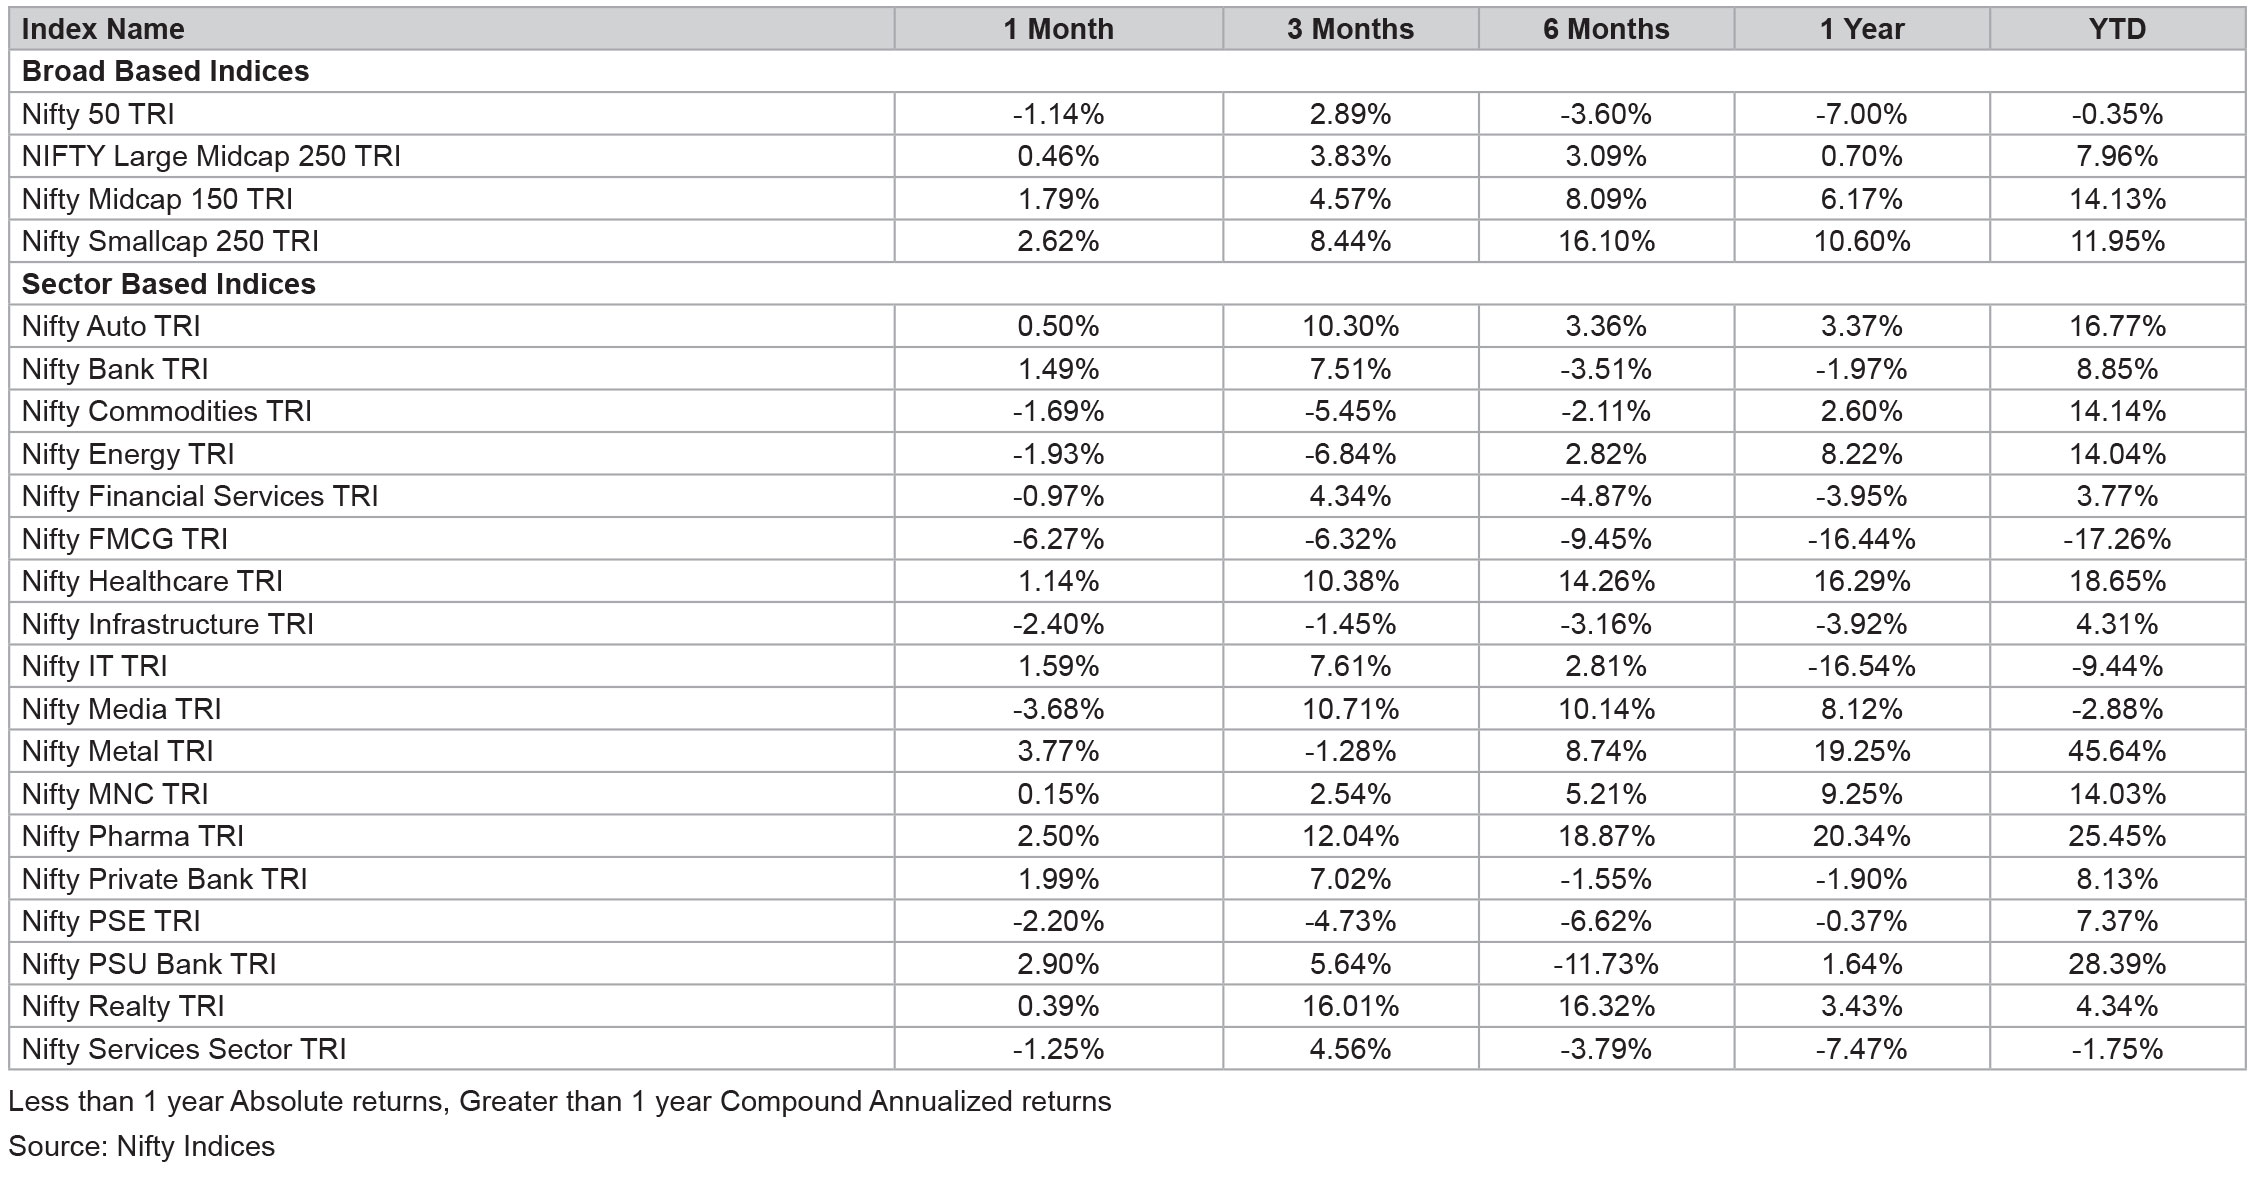
During the month, mid and small cap index outperformed the broader market with Nifty Small Cap 250 Index up by 2.5% and Nifty Midcap 150 Index by 1.7 %. Within sectoral capital goods index saw the highest rally with BSE CAP index up by 2.9%, followed by BSE Metals (+2.4%), BSE Healthcare & BSE Consumer discretionary by 1.5% each, BSE IT (+0.7%) and BSE Banks (+0.4%). BSE Oil index was down by 2.1%, followed by BSE Consumer Durables (-0.6%) and BSE Real Estate (-0.1%).
Foreign institutional investors remained net positive for the second consecutive month with inflows of USD 2.96bn in the month led by resilient economic activity, a stable rupee, and easing geopolitical concerns. Amongst emerging economies, Taiwan saw the highest inflow of USD 9.1bn, followed by Indonesia (+USD 68mn). South Korea for fourth straight month saw outflow of USD 8.6bn followed by Brazil (-USD 3.6bn), Thailand (-USD 746mn), Malaysia (-USD 486mn), Philippines (-USD 223mn) and Vietnam (-USD 67mn).
With regards to domestic institutional flows, Indian mutual fund industry grew by 13.8% YoY and 4.3% MoM with net asset of INR 85.76L crore in July 2026*. Equity flows continue to be net positive at INR 246.97bn in July, although declined by 14.8% MoM. Decline is primarily due to redemption in large cap funds, while small (+38.7% MoM) and mid cap (+1.7%) funds remain healthy. In terms of sector positioning, IT, autos and pharma saw increased interest while public sector banks witnessed a downturn.
Interest in the IT sector is mainly on account of valuations which have come down from its long-term average, while the overall sentiment remains weak given the slowdown in demand in the software segment and disruption from artificial intelligence. Auto sector remains favourable on account of strong demand post GST reforms announced last year. Interest in pharma & healthcare sector is largely driven by companies having higher share of revenues contributing from domestic formulation as Indian Pharmaceutical Market (IPM) growth has improved from 9-10% earlier to 11-13% and strong traction in Contract Development and Manufacturing Organization (CDMO). Healthcare segment too remains attractive led by massive bed capacity addition by hospital companies over the next 2-3 years.
On the geo-political front, tension continues in the middle east as both US and Iran continue their attacks. Crude oil prices rose more than 10% during the month crossing USD 90/barrel driven by the escalation of the US-Iran military conflict, and uncertainty on availability of crude oil supply. Global auto fuel prices have jumped to near record levels on surge in drone attacks by Ukraine striking ~73% of Russian refining capacity just in Aug 2026. However, the impact of energy shock has been moderated by Oil Marketing Companies by largely maintaining retail fuel prices in August after graded increase through May. Higher energy prices have weighed on cost inflation and equity markets in India. To counter shortage of LPG, Indian government laid down LPG production obligation for Indian refineries and is also fast tracking the transition of domestic households to PNG lines.
In the recently concluded corporate India result season, Nifty-500 delivered healthy earnings growth in 1QFY27, fuelled by a resilient macro environment, better-than-expected margin print, and improving operating conditions, which supported a strong earnings momentum. While this is positive for Indian markets, concerns over weak monsoon season continues to persist which can lead to inflationary pressure impacting profitability in 2HFY27. With Nifty 50 trading 20.4x trailing 12 months P/E, we remain cautiously optimistic.
Source: Kotak Securities/Capital 360 ONE, Motilal Oswal Securities, Industry reports. Data as on August 31, 2026.
*Mutual Fund industry data is published during mid-month August
Asian markets ended in green for the month of August, barring Hang Seng. After a sharp sell-off in July, South Korea and Taiwan saw healthy recovery during the month with KOSPI and Taiwan Index up by 3.4% and 7% respectively. Japanese market NIKKEI 225 too was up by 3% driven by AI and semiconductor themes. Chinese index SSE Composite (Shanghai Stock Exchange) was up by 4% led by strong macro-economic data, while Hong Kong’s Hang Seng was down by 1.2% on account of rising global interest rates and softer economic data.
Performance of developed European economies was a mixed bag with German index DAX up by 2.5%, while FTSE 100 Index (UK) and French CAC 40 down by 0.4% and 2.1% respectively. US market was up for the month of August with S&P 500 and Dow Jones up by 2.6% and 1.3% respectively driven by strong earnings season and a resilient AI trade.
During the month, mid and small cap index outperformed the broader market with Nifty Small Cap 250 Index up by 2.5% and Nifty Midcap 150 Index by 1.7 %. Within sectoral capital goods index saw the highest rally with BSE CAP index up by 2.9%, followed by BSE Metals (+2.4%), BSE Healthcare & BSE Consumer discretionary by 1.5% each, BSE IT (+0.7%) and BSE Banks (+0.4%). BSE Oil index was down by 2.1%, followed by BSE Consumer Durables (-0.6%) and BSE Real Estate (-0.1%).
Foreign institutional investors remained net positive for the second consecutive month with inflows of USD 2.96bn in the month led by resilient economic activity, a stable rupee, and easing geopolitical concerns. Amongst emerging economies, Taiwan saw the highest inflow of USD 9.1bn, followed by Indonesia (+USD 68mn). South Korea for fourth straight month saw outflow of USD 8.6bn followed by Brazil (-USD 3.6bn), Thailand (-USD 746mn), Malaysia (-USD 486mn), Philippines (-USD 223mn) and Vietnam (-USD 67mn).
With regards to domestic institutional flows, Indian mutual fund industry grew by 13.8% YoY and 4.3% MoM with net asset of INR 85.76L crore in July 2026*. Equity flows continue to be net positive at INR 246.97bn in July, although declined by 14.8% MoM. Decline is primarily due to redemption in large cap funds, while small (+38.7% MoM) and mid cap (+1.7%) funds remain healthy. In terms of sector positioning, IT, autos and pharma saw increased interest while public sector banks witnessed a downturn.
Interest in the IT sector is mainly on account of valuations which have come down from its long-term average, while the overall sentiment remains weak given the slowdown in demand in the software segment and disruption from artificial intelligence. Auto sector remains favourable on account of strong demand post GST reforms announced last year. Interest in pharma & healthcare sector is largely driven by companies having higher share of revenues contributing from domestic formulation as Indian Pharmaceutical Market (IPM) growth has improved from 9-10% earlier to 11-13% and strong traction in Contract Development and Manufacturing Organization (CDMO). Healthcare segment too remains attractive led by massive bed capacity addition by hospital companies over the next 2-3 years.
On the geo-political front, tension continues in the middle east as both US and Iran continue their attacks. Crude oil prices rose more than 10% during the month crossing USD 90/barrel driven by the escalation of the US-Iran military conflict, and uncertainty on availability of crude oil supply. Global auto fuel prices have jumped to near record levels on surge in drone attacks by Ukraine striking ~73% of Russian refining capacity just in Aug 2026. However, the impact of energy shock has been moderated by Oil Marketing Companies by largely maintaining retail fuel prices in August after graded increase through May. Higher energy prices have weighed on cost inflation and equity markets in India. To counter shortage of LPG, Indian government laid down LPG production obligation for Indian refineries and is also fast tracking the transition of domestic households to PNG lines.
In the recently concluded corporate India result season, Nifty-500 delivered healthy earnings growth in 1QFY27, fuelled by a resilient macro environment, better-than-expected margin print, and improving operating conditions, which supported a strong earnings momentum. While this is positive for Indian markets, concerns over weak monsoon season continues to persist which can lead to inflationary pressure impacting profitability in 2HFY27. With Nifty 50 trading 20.4x trailing 12 months P/E, we remain cautiously optimistic.
Source: Kotak Securities/Capital 360 ONE, Motilal Oswal Securities, Industry reports. Data as on August 31, 2026.
*Mutual Fund industry data is published during mid-month August
Debt Market Commentary – August 2026
The global geopolitical environment remains fragile, with the US-Iran ceasefire proving short-lived and intermittent episodes of hostility continuing to pose risks to the stability of global energy supplies. Renewed tensions have repeatedly triggered spikes in crude oil prices, adding another layer of uncertainty to an already challenging global macroeconomic environment. The persistence of supply-side risks is particularly concerning as higher energy prices can quickly feed through to headline inflation, transportation costs and broader input prices. Consequently, the global economy continues to bear the brunt of these developments, with inflationary pressures showing signs of rebuilding even as growth momentum remains vulnerable to tighter financial conditions.
At the same time, global bond markets are increasingly reflecting concerns around inflation, fiscal sustainability and elevated government borrowing requirements. Yields across major economies such as the US, Japan and the UK have come under renewed pressure, particularly at the longer end of the curve, highlighting growing concerns over sovereign debt dynamics and the ability of governments to absorb higher financing costs. The rise in global yields is also exerting pressure on emergingmarket currencies, as higher developed-market yields alter relative return differentials and encourage greater selectivity in global capital allocation. With capital flows becoming increasingly volatile, financial markets are witnessing sharper movements across currencies, bonds and equities, resulting in elevated asset-price volatility.
These developments are also contributing to a growing divergence in global monetary dynamics. While some central banks have already responded through policy rate increases, others are relying more heavily on hawkish communication and forward guidance to contain inflation expectations and influence financial conditions without necessarily delivering immediate policy action. The challenge is particularly pronounced for the US Federal Reserve, where managing market expectations is becoming increasingly difficult amid the conflicting objectives of containing inflation, supporting growth and maintaining financial stability. Elevated long-term yields are already tightening financial conditions, while the persistence of high yields could complicate the process of balance-sheet reduction by increasing the sensitivity of markets and government financing conditions to further monetary tightening. As a result, the distinction between actual policy action and policy communication is becoming increasingly important, with markets increasingly pricing the underlying macroeconomic reality rather than responding solely to central-bank guidance. Overall, the global environment remains characterised by a combination of geopolitical risks, renewed inflationary pressures, elevated sovereign yields, volatile capital flows and increasingly divergent monetary-policy responses, suggesting that financial-market volatility is likely to remain elevated.
Domestic Economy-
The domestic economy has demonstrated notable resilience amidst the ongoing global headwinds, led by strong domestic demand. Rising manufacturing and services activity have been the necessary elements of the economy. Adding to it is the renewed support from pick up in monsoon. The south-west monsoon picked up pace in July-2026 after recording a deficit in June-2026. The pick-up in monsoon activity during July supported kharif sowing, taking it closer to the previous year’s level.
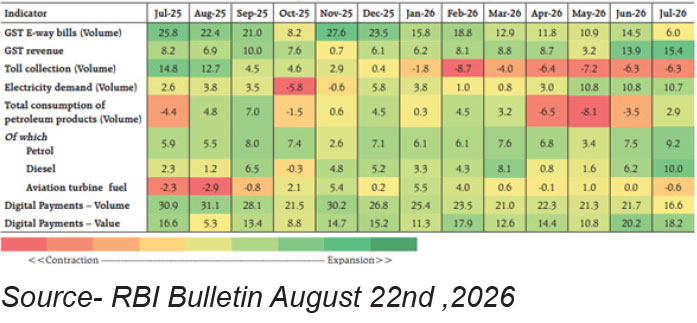
Domestic demand remained buoyant, as reflected by several indicators, including vehicle and tractor sales. Industrial production strengthened sharply in June-2026, recording its strongest growth in nearly two years, supported by a broad-based acceleration in manufacturing. Goods and Services Tax (GST) revenue growth strengthened, driven by robust growth in tax revenue from imports, while domestic collections also recorded healthy growth. Growth in petroleum consumption rebounded, after contracting in the preceding three months, led by petrol and diesel, although aviation turbine fuel consumption remained subdued. Delayed monsoons and high humidity drove a surge in cooling needs, leading to sustained growth in electricity demand. Non-food credit growth continued to remain healthy. Credit growth continued to remain healthy in July. The recent deposit mobilisation by scheduled commercial banks’ (SCBs’) helped the incremental credit-deposit ratio to moderate. Liquidity conditions eased, supporting credit growth and ongoing investment activity. Foreign capital inflows rebounded, reinforcing the external sector.
On the external front both merchandise exports and imports grew strongly in July-2026 with exports growing at a four-month high (in 2026-27 so far). Merchandise trade deficit widened in July-2026, both sequentially and on a year-on-year basis, reflecting a widening of deficit in electronic goods.
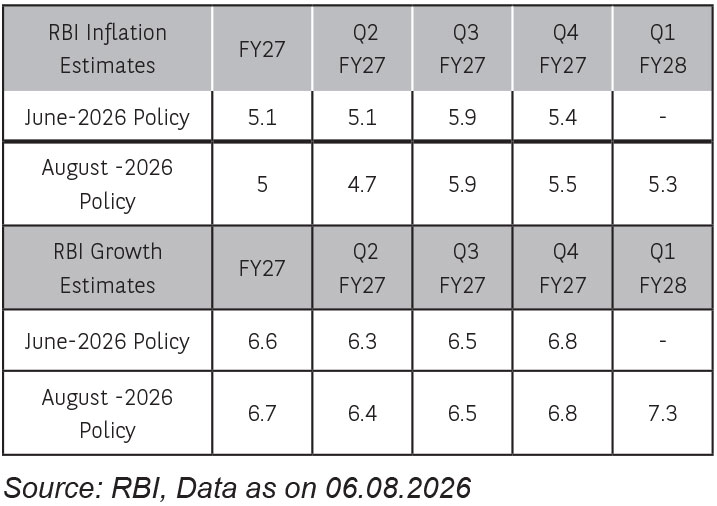
RBI in its August-2026 monetary policy meeting, decided to keep the policy repo rate unchanged at 5.25%, while retaining the neutral policy stance. The decision marks a continued wait-and-watch approach, with the RBI seeking greater clarity on the inflation trajectory while remaining supportive of a resilient domestic growth environment. The policy represents a balanced rather than clearly dovish or hawkish policy decision. Post June and Mid July, the growth-inflation trade-off has become more favourable. As crude prices have fallen and remain range bound, monsoon activity has also shown a pickup, therefore RBI too has shown more confidence on economic growth and inflation, raising its FY27 GDP forecast to 6.7%, while simultaneously trimming its inflation forecast to 5.0%. This reduces the immediate need for further monetary support while also limiting the case for additional tightening.
Domestic Inflation-
Fixed Income Outlook – September 2026
India’s fixed income market is entering September at an interesting inflection point: growth is proving stronger than expected, liquidity remains abundant, but the inflation and policy outlook is turning less benign. Q1 FY27 real GDP growth at 7.8%, well above the RBI's 7.0% projection, confirms that domestic growth momentum remains resilient. The growth mix was also encouraging, with investment and manufacturing activity remaining strong. The stronger-than-expected growth print reduces the urgency for further monetary accommodation and gives the RBI greater flexibility to remain focused on the inflation trajectory.
At the same time, the inflation outlook has become less benign. July CPI inflation increased to 4.45% , while food inflation rose to 5.52%. Although the August MPC kept the repo rate unchanged at 5.25% and retained a neutral stance, the subsequent MPC minutes were notably more hawkish. The minutes highlighted the risk of second-round effects from food, fuel and input costs, while indicating that a rate hike could become appropriate during FY27 if inflation pressures persist. Consequently, the market has started assigning a higher probability to a rate hike during FY27, rather than expecting further easing.
The global rate environment also remains a source of volatility. At Jackson Hole, Federal Reserve Chair Kevin Warsh emphasised that US inflation remains above the Fed's 2% objective, with PCE inflation at 3.7%, and noted that recent improvements in inflation have not yet demonstrated a sufficiently convincing downward trend. He also observed that broader financial conditions remain relatively accommodative. This reinforces the risk of global yields remaining elevated and limits the scope for a sustained decline in domestic long-term yields.
Growth resilience reduces the case for monetary accommodation
The 7.8% Q1 FY27 GDP print provides a strong starting point to the financial year and suggests that domestic demand has remained resilient despite global uncertainties. The strength of investment and manufacturing is particularly relevant for the rates outlook, as it reduces the likelihood of growth concerns becoming a binding constraint on monetary policy. We therefore expect the RBI's reaction function to remain increasingly centred on the inflation trajectory.
Liquidity remains supportive despite a changing policy backdrop
The liquidity environment remains unusually supportive following strong mobilisation under the RBI's special FCNR(B) deposit and swap facility. USD 136.377 billion of foreign currency inflows had been mobilised by August 31, 2026 including USD 127.226 billion through FCNR(B) deposits. The resulting conversion of foreign currency into rupees has materially increased banking-system liquidity.
The combination of strong FCNR(B) inflows and bond redemptions has created a substantial liquidity cushion. While the RBI is likely to manage this surplus through liquidity-absorption operations, the near-term abundance of liquidity should continue to provide support to moneymarket instruments and the front end of the curve.
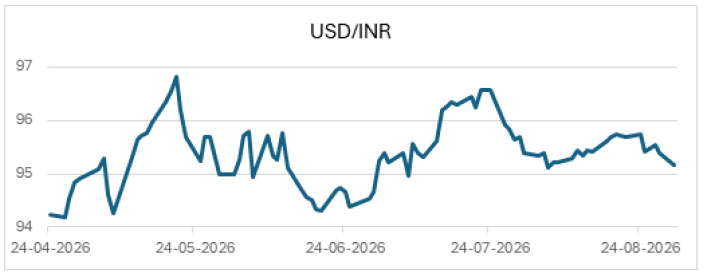
The USD/INR exchange rate peaked near 96.57 in late July before steadily declining toward 95.16 by the end of August 2026. This downward correction and subsequent stabilization of the rupee were directly driven by robust FCNR(B) dollar inflows, which accelerated significantly before the RBI's special swap window officially shut down on August 31, 2026.
Source-Bloomberg, Data as on August 31st, 2026
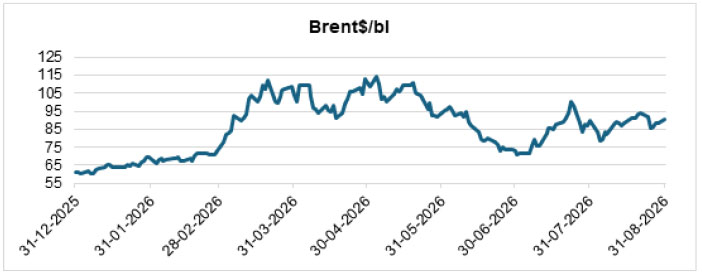
Following a sharp decline to a low near $71/bl in late June, Brent crude prices rebounded significantly to peak near $101/bl in late July before consolidating between $80 and $95/bl through August 2026.
Source-Bloomberg, Data as on August 31st, 2026
G-sec and T-bill Curve: Front End Supported, Intermediate Segment Reprices
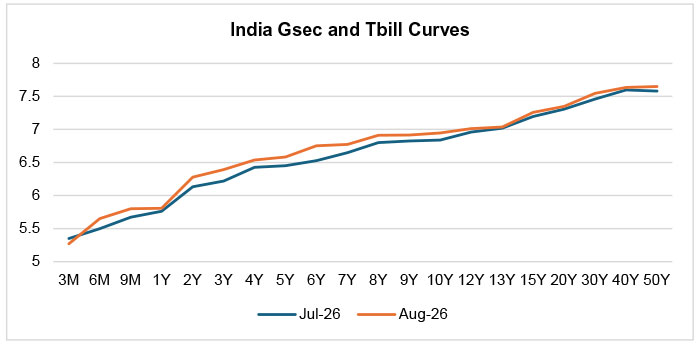
The government securities curve witnessed a meaningful upward shift in the intermediate segment during August. The 3-month T-bill yield declined by 8 bps to 5.27%, reflecting abundant short-term liquidity, while 6-month and 9-month T-bill yields increased by 15 bps and 13 bps respectively. Further out, the 2-year and 3-year G-sec yields increased by 15 bps from 6.13 to 6.28 and 17 bps from 6.22 to 6.39, respectively, while the 5-year yield rose by 13 bps from 6.45 to 658. The 10-year yield moved higher by around 11 bps to 6.95%.
The curve movement indicates that liquidity is providing stronger support to the very front end, while the intermediate segment is increasingly reflecting the changed policy outlook following the stronger GDP print and hawkish MPC minutes. We continue to see better risk-reward in the 2–5 year segment than at the long end, where inflation, global yields and fiscal supply remain important headwinds.
Source-Bloomberg, Data as on August 31st, 2026
Certificate of Deposit (CD) Curve: Short End Eases, Longer Tenors Reprice
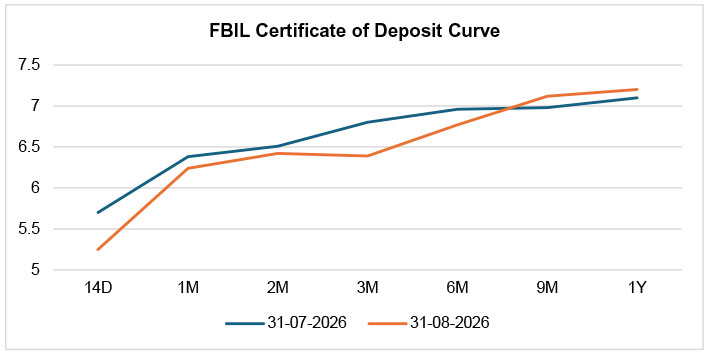
The FBIL CD curve showed a clear divergence between the short and longer maturities during August. The 3-month and 6-month rates declined by 41 bps and 19 bps respectively. In contrast, 9-month and 1-year CD rates increased by 14 bps and 10 bps to 7.12% and 7.20%, respectively
The steepening in the CD curve reflects the impact of abundant system liquidity at the short end, while longer maturities are increasingly incorporating expectations of a higher-for-longer policy environment. The 9-month to 1-year segment therefore offers attractive carry, although the elevated spread over corresponding G-sec yields also indicates that the market is demanding a meaningful liquidity and credit premium.
Source-Bloomberg, Data as on August 31st, 2026
G-sec – SDL Spread: Selective Value in State Development Loans
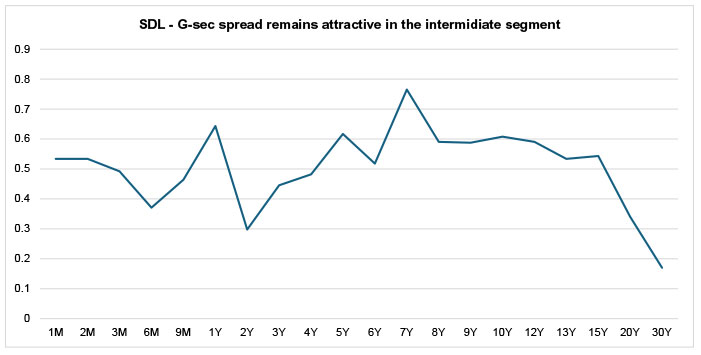
SDL spreads remain relatively elevated across the intermediate segment. As of end-August, the SDL-Gsec spread was around 64 bps at 1-year, 62 bps at 5-year and 61 bps at 10-year, while the spread narrowed materially towards the longer end, to around 17 bps at 30-year.
The relatively wide spreads in the 1–10 year segment suggest that SDLs continue to offer incremental carry over central government securities. However, the dispersion across maturities argues against a broadbased duration allocation. We prefer selectively adding SDL exposure where the spread adequately compensates for liquidity and state-level supply risks, particularly in the intermediate segment.
Source-Bloomberg, Data as on August 31st, 2026
Outlook
Our view on Indian fixed income remains constructive on carry, but selective on duration. The strongerthan- expected Q1 GDP growth, a higher near-term inflation trajectory and the more hawkish tone of the MPC minutes have materially reduced the probability of further monetary easing and increased the risk of a policy tightening during FY27.
At the same time, the exceptional FCNR(B) mobilisation has created a significant liquidity cushion, supporting the front end and money-market instruments. This divergence is visible across the curve: short-term T-bills and CDs have benefited from surplus liquidity, while intermediate and longer-duration G-sec yields have repriced higher.
We prefer the 2–5 year segment for a combination of carry and relative duration risk, while selectively evaluating 9–12 month credit instruments and SDLs where spreads adequately compensate for liquidity and credit risk. At the long end, we remain more cautious given the uncertainty around inflation, crude oil prices, global bond yields and future policy normalisation.
The key monitorables for the coming months will be food and core inflation, crude oil prices, INR stability, global bond yields, RBI liquidity management and the persistence of domestic growth momentum. A moderation in commodity prices and inflation, combined with stable global yields, could create opportunities to add duration at attractive levels. Conversely, sustained commodity price pressures or further INR weakness could result in renewed upward pressure on yields.
Overall, we favour earning carry while maintaining flexibility on duration, with incremental duration additions to be considered during episodes of market-driven yield dislocation rather than through aggressive directional positioning.
The material contained herein has been obtained from publicly available information, believed to be reliable, but Baroda BNP Paribas Asset Management India Private Limited (BBNPPAMIPL) makes no representation that it is accurate or complete. This information is meant for general reading purposes only and is not meant to serve as a professional guide for the readers. This information is not intended to be an offer to see or a solicitation for the purchase or sale of any financial product or instrument. Past Performance may or may not be sustained in future and is not a guarantee of future returns.
The global geopolitical environment remains fragile, with the US-Iran ceasefire proving short-lived and intermittent episodes of hostility continuing to pose risks to the stability of global energy supplies. Renewed tensions have repeatedly triggered spikes in crude oil prices, adding another layer of uncertainty to an already challenging global macroeconomic environment. The persistence of supply-side risks is particularly concerning as higher energy prices can quickly feed through to headline inflation, transportation costs and broader input prices. Consequently, the global economy continues to bear the brunt of these developments, with inflationary pressures showing signs of rebuilding even as growth momentum remains vulnerable to tighter financial conditions.
At the same time, global bond markets are increasingly reflecting concerns around inflation, fiscal sustainability and elevated government borrowing requirements. Yields across major economies such as the US, Japan and the UK have come under renewed pressure, particularly at the longer end of the curve, highlighting growing concerns over sovereign debt dynamics and the ability of governments to absorb higher financing costs. The rise in global yields is also exerting pressure on emergingmarket currencies, as higher developed-market yields alter relative return differentials and encourage greater selectivity in global capital allocation. With capital flows becoming increasingly volatile, financial markets are witnessing sharper movements across currencies, bonds and equities, resulting in elevated asset-price volatility.
These developments are also contributing to a growing divergence in global monetary dynamics. While some central banks have already responded through policy rate increases, others are relying more heavily on hawkish communication and forward guidance to contain inflation expectations and influence financial conditions without necessarily delivering immediate policy action. The challenge is particularly pronounced for the US Federal Reserve, where managing market expectations is becoming increasingly difficult amid the conflicting objectives of containing inflation, supporting growth and maintaining financial stability. Elevated long-term yields are already tightening financial conditions, while the persistence of high yields could complicate the process of balance-sheet reduction by increasing the sensitivity of markets and government financing conditions to further monetary tightening. As a result, the distinction between actual policy action and policy communication is becoming increasingly important, with markets increasingly pricing the underlying macroeconomic reality rather than responding solely to central-bank guidance. Overall, the global environment remains characterised by a combination of geopolitical risks, renewed inflationary pressures, elevated sovereign yields, volatile capital flows and increasingly divergent monetary-policy responses, suggesting that financial-market volatility is likely to remain elevated.
Domestic Economy-
The domestic economy has demonstrated notable resilience amidst the ongoing global headwinds, led by strong domestic demand. Rising manufacturing and services activity have been the necessary elements of the economy. Adding to it is the renewed support from pick up in monsoon. The south-west monsoon picked up pace in July-2026 after recording a deficit in June-2026. The pick-up in monsoon activity during July supported kharif sowing, taking it closer to the previous year’s level.
Domestic demand remained buoyant, as reflected by several indicators, including vehicle and tractor sales. Industrial production strengthened sharply in June-2026, recording its strongest growth in nearly two years, supported by a broad-based acceleration in manufacturing. Goods and Services Tax (GST) revenue growth strengthened, driven by robust growth in tax revenue from imports, while domestic collections also recorded healthy growth. Growth in petroleum consumption rebounded, after contracting in the preceding three months, led by petrol and diesel, although aviation turbine fuel consumption remained subdued. Delayed monsoons and high humidity drove a surge in cooling needs, leading to sustained growth in electricity demand. Non-food credit growth continued to remain healthy. Credit growth continued to remain healthy in July. The recent deposit mobilisation by scheduled commercial banks’ (SCBs’) helped the incremental credit-deposit ratio to moderate. Liquidity conditions eased, supporting credit growth and ongoing investment activity. Foreign capital inflows rebounded, reinforcing the external sector.
On the external front both merchandise exports and imports grew strongly in July-2026 with exports growing at a four-month high (in 2026-27 so far). Merchandise trade deficit widened in July-2026, both sequentially and on a year-on-year basis, reflecting a widening of deficit in electronic goods.
RBI in its August-2026 monetary policy meeting, decided to keep the policy repo rate unchanged at 5.25%, while retaining the neutral policy stance. The decision marks a continued wait-and-watch approach, with the RBI seeking greater clarity on the inflation trajectory while remaining supportive of a resilient domestic growth environment. The policy represents a balanced rather than clearly dovish or hawkish policy decision. Post June and Mid July, the growth-inflation trade-off has become more favourable. As crude prices have fallen and remain range bound, monsoon activity has also shown a pickup, therefore RBI too has shown more confidence on economic growth and inflation, raising its FY27 GDP forecast to 6.7%, while simultaneously trimming its inflation forecast to 5.0%. This reduces the immediate need for further monetary support while also limiting the case for additional tightening.
Domestic Inflation-
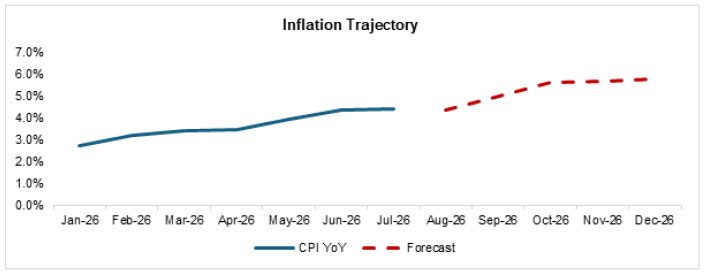
- Headline inflation was in line with expectations at 4.4% y/y in July-2026.
- Food and beverage inflation stood at 5.24% in July-26. Sequentially food and beverage inflation increased by 2% m/m driven by higher prices of cereals, meat, pulses, sugar and ready-made products.
- The rise in fuel inflation reflects past increases in transportation fuels (petrol, diesel, and CNG) and LPG. Subsidized LPG prices were increased by 3.1% m/m in June but some pass through is witnessed in July-2026.
- Core inflation stood at 4.16% y/y in July-2026, similar to last three months. Pass through commercial LPG price hikes in previous months continues to reflect in restaurants and hotels.
- Continued increases are seen in items such as induction stoves and metal utensils. Meanwhile, personal care remains elevated due to the past surge in gold and silver prices.
- Headline inflation is expected to average below 5% in FY27. Risks to headline forecast remains from supplyside factors such as fuel and food. We expect RBI to remain on pause and vigilant about inflation in Q3 FY27 as inflation remains above 5% and any shock can lead to inflation crossing the 6% mark. The probability of rate hike if any, stands then.
Fixed Income Outlook – September 2026
India’s fixed income market is entering September at an interesting inflection point: growth is proving stronger than expected, liquidity remains abundant, but the inflation and policy outlook is turning less benign. Q1 FY27 real GDP growth at 7.8%, well above the RBI's 7.0% projection, confirms that domestic growth momentum remains resilient. The growth mix was also encouraging, with investment and manufacturing activity remaining strong. The stronger-than-expected growth print reduces the urgency for further monetary accommodation and gives the RBI greater flexibility to remain focused on the inflation trajectory.
At the same time, the inflation outlook has become less benign. July CPI inflation increased to 4.45% , while food inflation rose to 5.52%. Although the August MPC kept the repo rate unchanged at 5.25% and retained a neutral stance, the subsequent MPC minutes were notably more hawkish. The minutes highlighted the risk of second-round effects from food, fuel and input costs, while indicating that a rate hike could become appropriate during FY27 if inflation pressures persist. Consequently, the market has started assigning a higher probability to a rate hike during FY27, rather than expecting further easing.
The global rate environment also remains a source of volatility. At Jackson Hole, Federal Reserve Chair Kevin Warsh emphasised that US inflation remains above the Fed's 2% objective, with PCE inflation at 3.7%, and noted that recent improvements in inflation have not yet demonstrated a sufficiently convincing downward trend. He also observed that broader financial conditions remain relatively accommodative. This reinforces the risk of global yields remaining elevated and limits the scope for a sustained decline in domestic long-term yields.
Growth resilience reduces the case for monetary accommodation
The 7.8% Q1 FY27 GDP print provides a strong starting point to the financial year and suggests that domestic demand has remained resilient despite global uncertainties. The strength of investment and manufacturing is particularly relevant for the rates outlook, as it reduces the likelihood of growth concerns becoming a binding constraint on monetary policy. We therefore expect the RBI's reaction function to remain increasingly centred on the inflation trajectory.
Liquidity remains supportive despite a changing policy backdrop
The liquidity environment remains unusually supportive following strong mobilisation under the RBI's special FCNR(B) deposit and swap facility. USD 136.377 billion of foreign currency inflows had been mobilised by August 31, 2026 including USD 127.226 billion through FCNR(B) deposits. The resulting conversion of foreign currency into rupees has materially increased banking-system liquidity.
The combination of strong FCNR(B) inflows and bond redemptions has created a substantial liquidity cushion. While the RBI is likely to manage this surplus through liquidity-absorption operations, the near-term abundance of liquidity should continue to provide support to moneymarket instruments and the front end of the curve.
The USD/INR exchange rate peaked near 96.57 in late July before steadily declining toward 95.16 by the end of August 2026. This downward correction and subsequent stabilization of the rupee were directly driven by robust FCNR(B) dollar inflows, which accelerated significantly before the RBI's special swap window officially shut down on August 31, 2026.
Source-Bloomberg, Data as on August 31st, 2026
Following a sharp decline to a low near $71/bl in late June, Brent crude prices rebounded significantly to peak near $101/bl in late July before consolidating between $80 and $95/bl through August 2026.
Source-Bloomberg, Data as on August 31st, 2026
G-sec and T-bill Curve: Front End Supported, Intermediate Segment Reprices
The government securities curve witnessed a meaningful upward shift in the intermediate segment during August. The 3-month T-bill yield declined by 8 bps to 5.27%, reflecting abundant short-term liquidity, while 6-month and 9-month T-bill yields increased by 15 bps and 13 bps respectively. Further out, the 2-year and 3-year G-sec yields increased by 15 bps from 6.13 to 6.28 and 17 bps from 6.22 to 6.39, respectively, while the 5-year yield rose by 13 bps from 6.45 to 658. The 10-year yield moved higher by around 11 bps to 6.95%.
The curve movement indicates that liquidity is providing stronger support to the very front end, while the intermediate segment is increasingly reflecting the changed policy outlook following the stronger GDP print and hawkish MPC minutes. We continue to see better risk-reward in the 2–5 year segment than at the long end, where inflation, global yields and fiscal supply remain important headwinds.
Source-Bloomberg, Data as on August 31st, 2026
Certificate of Deposit (CD) Curve: Short End Eases, Longer Tenors Reprice
The FBIL CD curve showed a clear divergence between the short and longer maturities during August. The 3-month and 6-month rates declined by 41 bps and 19 bps respectively. In contrast, 9-month and 1-year CD rates increased by 14 bps and 10 bps to 7.12% and 7.20%, respectively
The steepening in the CD curve reflects the impact of abundant system liquidity at the short end, while longer maturities are increasingly incorporating expectations of a higher-for-longer policy environment. The 9-month to 1-year segment therefore offers attractive carry, although the elevated spread over corresponding G-sec yields also indicates that the market is demanding a meaningful liquidity and credit premium.
Source-Bloomberg, Data as on August 31st, 2026
G-sec – SDL Spread: Selective Value in State Development Loans
SDL spreads remain relatively elevated across the intermediate segment. As of end-August, the SDL-Gsec spread was around 64 bps at 1-year, 62 bps at 5-year and 61 bps at 10-year, while the spread narrowed materially towards the longer end, to around 17 bps at 30-year.
The relatively wide spreads in the 1–10 year segment suggest that SDLs continue to offer incremental carry over central government securities. However, the dispersion across maturities argues against a broadbased duration allocation. We prefer selectively adding SDL exposure where the spread adequately compensates for liquidity and state-level supply risks, particularly in the intermediate segment.
Source-Bloomberg, Data as on August 31st, 2026
Outlook
Our view on Indian fixed income remains constructive on carry, but selective on duration. The strongerthan- expected Q1 GDP growth, a higher near-term inflation trajectory and the more hawkish tone of the MPC minutes have materially reduced the probability of further monetary easing and increased the risk of a policy tightening during FY27.
At the same time, the exceptional FCNR(B) mobilisation has created a significant liquidity cushion, supporting the front end and money-market instruments. This divergence is visible across the curve: short-term T-bills and CDs have benefited from surplus liquidity, while intermediate and longer-duration G-sec yields have repriced higher.
We prefer the 2–5 year segment for a combination of carry and relative duration risk, while selectively evaluating 9–12 month credit instruments and SDLs where spreads adequately compensate for liquidity and credit risk. At the long end, we remain more cautious given the uncertainty around inflation, crude oil prices, global bond yields and future policy normalisation.
The key monitorables for the coming months will be food and core inflation, crude oil prices, INR stability, global bond yields, RBI liquidity management and the persistence of domestic growth momentum. A moderation in commodity prices and inflation, combined with stable global yields, could create opportunities to add duration at attractive levels. Conversely, sustained commodity price pressures or further INR weakness could result in renewed upward pressure on yields.
Overall, we favour earning carry while maintaining flexibility on duration, with incremental duration additions to be considered during episodes of market-driven yield dislocation rather than through aggressive directional positioning.
Source- Bloomberg, RBI, MOSPI, TMA, Data latest available as on September 01,2026
The material contained herein has been obtained from publicly available information, believed to be reliable, but Baroda BNP Paribas Asset Management India Private Limited (BBNPPAMIPL) makes no representation that it is accurate or complete. This information is meant for general reading purposes only and is not meant to serve as a professional guide for the readers. This information is not intended to be an offer to see or a solicitation for the purchase or sale of any financial product or instrument. Past Performance may or may not be sustained in future and is not a guarantee of future returns.