Market Outlook
Market Outlook
| March 2026 |
|

|
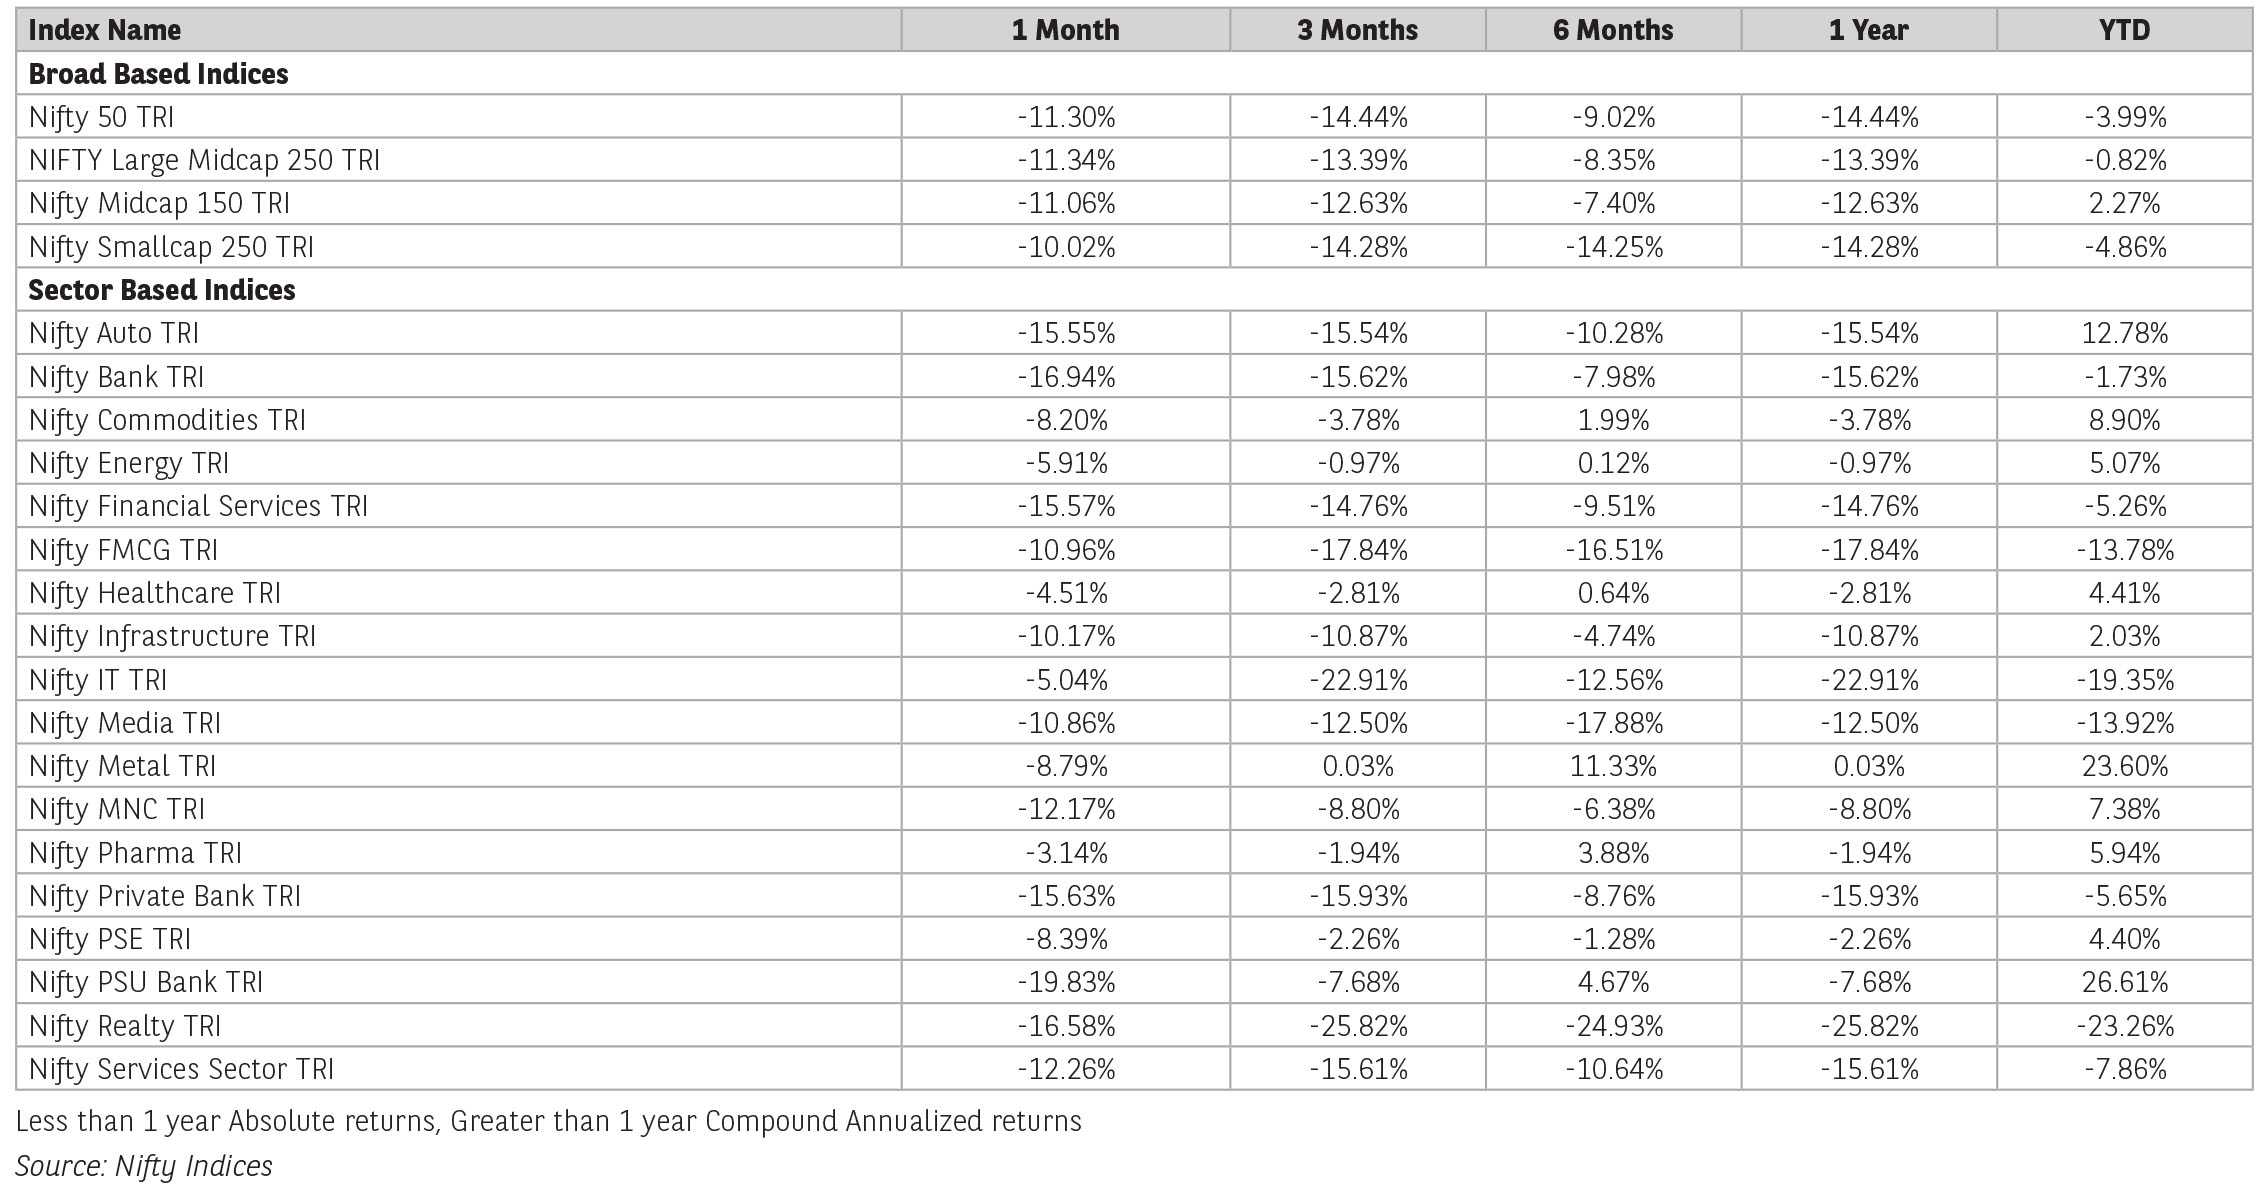
Nifty 50 was down by 11.3% for the month of March, steepest monthly fall since covid. Amongst Asian markets, South Korean market (KOSPI) after reporting strong growth over the last few months was down by 19.1% in March, followed by Japan (NIKKEI 225) (-13.2%), Taiwan Index (-10.4%), Hang Seng Index (-6.9%) and SSE Composite (Shanghai Stock Exchange) (-6.5%). In Europe, German Index DAX was down by 10.3%, followed by France CAC 40 Index (-8.9%) and FTSE 100 Index (UK) by 6.7%. In the US S&P 500 and Dow Jones were down by 5.1% and 5.4% respectively.
Midcap and small cap index too declined in tandem with the broader market with Nifty Midcap 150 Index down by 11.1% and Nifty Small Cap 250 Index by 10%. Sector wise all the sectors were down with BSE Bank down by 17%, followed by BSE Real Estate (-16.8%), BSE Oil (-13.6%), BSE Consumer Discretionary (-13%) Consumer Durables (-11.1%), BSE Metals (-8.9%), BSE Cap Goods (-8.8%) and BSE Healthcare (-4.9%). For FY26 Nifty 50 was down by 5.1%, Nifty Small Cap 250 Index by 5.4%, however Nifty Mid Cap 150 Index was up by 1.6%.
As the impact of war intensifies, along with rising crude oil prices and weakening rupee, FPI flows in March were negative with net outflow at record high of USD 12.1bn. Global uncertainty has led to sell-off across emerging economies, barring Brazil which saw net inflow of USD 1.5bn. Taiwan saw the highest selling of USD 26.3bn, followed by South Korea (-USD 21.3bn) and Indonesia (-USD 1.3bn)
The war which started on 28th February has entered 2nd month leading to global disruption. As the impact of war intensified through the month, energy prices have surged and supply chain has been disrupted. The Strait of Hormuz which controls almost 20% of global oil & gas supply has largely remained closed, with limited access to certain countries. From over 100 vessels per day before the conflict, daily traffic through the strait now totals fewer than five ships, according to data from the International Monetary Fund.
The closure has led to sever oil shock with crude oil jumping to USD 118/barrel from USD 78/barrel at start of March. Iran has also attacked major energy infrastructure of neighbouring countries leading to massive cuts of key gas production. With the war likely to continue to another 2-3 weeks as per comments made by President Trump, oil & gas prices will be key to watch out for as it poses a risk of global inflation.
With respect to India, although equity markets have reacted to the war and energy crisis, at the corporate level impact is yet to be seen. Raw material and commodity prices have started to increase; availability of commercial gases has led to lower capacity utilization for many sectors. Increasing crude oil prices may also impact current account and eventually leading to rupee depreciation which is up by 4.2% in March.
Given Indian economy’s reliance on energy imports, an elevated crude level weigh will on GDP growth, corporate earnings and inflation levels. At this juncture stock market has factored in one to two months of impact to earnings from oil shock. Post-correction valuations have turned compelling, and the long-term outlook for markets remains robust. Near term uncertainty though from West Asian conflict remains a key ponderable event. Remain cautiously optimistic on equity markets.
Source: Kotak Securities, Industry reports. Data as on March 31, 2026
Global Economy –
Higher volatility has become the new norm in today’s global financial landscape, driven largely by a shifting world order and increasing geopolitical uncertainties. The evolving balance of power among nations has amplified instability across asset classes, making markets more reactive and unpredictable. The recent conflict in West Asia has further underscored a critical shift, value is no longer determined solely by ownership of assets or commodities, but increasingly by control over trade routes and supply chains. This strategic control directly influences pricing, availability, and ultimately the economic outcomes for nations and investors alike, reinforcing volatility as a persistent feature of the modern era.
While controlling oil markets may appear to be the most visible motive for a capitalist economy like the United States, the Iran–Israel conflict reflects deeper strategic objectives. Beyond energy economics, it is also about asserting regional dominance and influencing the political trajectory within Iran. In this context, the United States stands to benefit by leveraging established capitalist mechanisms around critical commodities, positioning itself to extract strategic and economic advantage from the evolving geopolitical landscape.
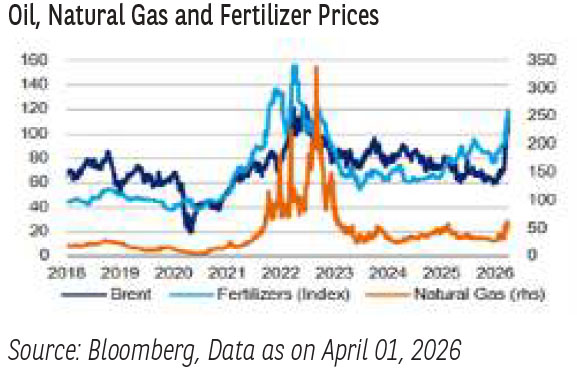
The timing and duration of the war remain highly unpredictable, but its economic impact is expected to persist for at least the next two quarters. Brent crude oil prices exhibited volatility with prices moving from US$ 78 per barrel to US$ 112.2 per barrel in March-26, implying higher inflation for coming months and high debt burden for net importers of crude, therefore pressuring yields. B Other global commodities too came under intense pressure from supply disruptions across trade, but also the markets for fuel products and LNG, critical industrial inputs like aluminium and urea were adversely affected.
Gold prices also witnessed volatility declining during peak war, opposite to the general safe haven properties.
Emerging market currencies witnessed depreciating pressures led by higher import bill and change in foreign flows.
The year 2026 already signals a shift toward greater global aggression and a more fragmented, possibly alliance-light world economy. The costs of this transition are increasingly visible, particularly for Asian economies that are heavily dependent on crude imports.
Across markets, the stress is evident, currencies have weakened, equities have faced volatility, bond markets have reacted to shifting risk perceptions, and commodities have seen sharp and often erratic movements—further reinforcing the fragile and uncertain state of the global financial system.
Domestic Economy-
The West Asia war added an unexpected twist to India’s macro-outlook, highlighting our pain points as an economy dependent on external energy supplies. Higher crude prices for long will have spillovers on domestic inflation as well as will be negative fiscally. The latter has already been witnessed with recent cut in excise duty, in an attempt to absorb some of the crude shocks pressuring the domestic yields. On March 27, the government cut excise duties for petrol and diesel by Rs10 per litre each, bringing them down to Rs 3 per litre on petrol and zero on diesel. Further, the government has introduced export duties of Rs21.5/litre on diesel and Rs29.5/litre on ATF. In terms of fiscal impact, a potential revenue loss of ~₹1.8 trillion, translating to ~0.45% of GDP in fiscal slippage on an annualised basis. However, if the duty cut is sustained only for 3–6 months, the impact would be more contained at ~0.1–0.25% of GDP. Also, the above is expected to be partially offset by higher excise duties on exports on petrol and ATF. The net impact is expected around Rs.650bn or 0.2% of GDP.
INR to remain under pressure –
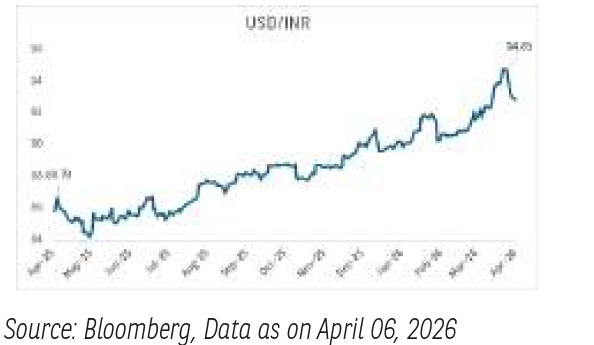
INR remained weighed down by (1) accommodative monetary policy, (2) delays to the India-US trade deal, (3) continuous FPI outflows and (4) widening trade deficit. With global demand and flows at risk, India’s external balance is facing headwinds, keeping the INR on depreciation bias. Indian rupee depreciated to a new low of 95 amidst mounting import pressures. RBI has resorted to curbing speculative activity against the INR through measures like capping the banks daily onshore currency open positions to US$100mn, followed by prohibiting banks to offering non-deliverable derivative contracts to resident/non-resident users along with restricting rebooking any foreign exchange derivative contract involving INR.
PMI survey reflect stress -
Growth across India's manufacturing industry took a step back in March as cost pressures, fierce competition, heightened market uncertainty and the war in the Middle East all led to softer increases in new orders and output.
Centre’s H1 FY27 Borrowing -
RBI released the indicative calendar for issuance of Government dated securities, including Sovereign Green Bonds, for the first half of the fiscal year 2026-27 (April 01, 2026, to September 30, 2026), through which the central government plans to borrow 51% of its total FY27 budgeted gross borrowings in H1 FY27 vs 54% in H1 FY26.
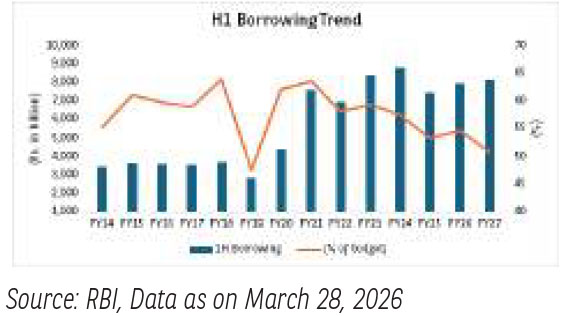
- The H1 FY27 gross g-sec borrowing in absolute terms was at INR8.2tn v/s INR8.0tn in H1 FY26. Net borrowing is at INR 5.7tn v/s INR5.0tn in H1FY26.
- With steepening of the curve, the maturity wise share of the total issuance depicts higher issuances on shorter end and belly of the curve. The share of long-term issuances (10 years and above) has moderated from 74.9% in H1 FY26 to 68% in H1 FY 27.
- Digging deeper the supply in the 10-year segment is the highest at 29% of total H1 FY27 issuance vs 27.5% in FY26, followed by the 5-year and 15-year segments.
Inflation increased to 3.2% in Feb’26 vs. 2.7% in Feb’26
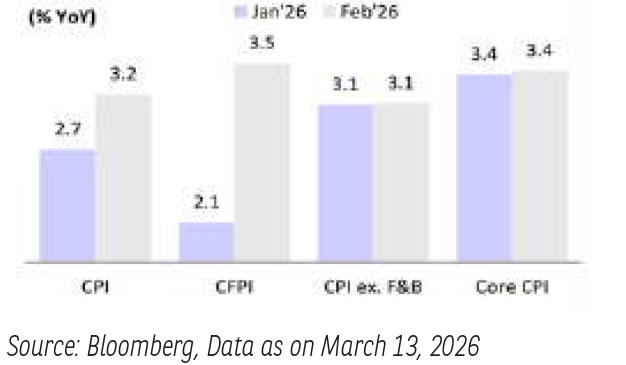
- CPI inflation rose to 3.21% in Feb-26 from 2.74% in Jan-26. Food and beverage inflation increased to 3.4% y/y in Feb-26 from 2.1% y/y in Jan-26.
- Core CPI edged up marginally to 3.41% y/y in Feb-26 from 3.37% y/y in Jan-26. Inflation in paan, tobacco, and intoxicants rose owing to higher excise duties on tobacco products. Personal care and effects increased 1.5% m/m led by higher gold and silver prices.
- We expect CPI inflation to average ~4.5% in FY27. Going forward, higher LPG prices and freight costs could exert some upward pressure on inflation.
- The RBI is likely to remain cautious given increase in LPG prices amid shortages and higher freight costs.
Domestic Liquidity -
- Liquidity surplus narrowed but remained comfortable for second half of March-2026.
- RBI has proactively used OMO purchases to support domestic yields. We expect banking system liquidity conditions to improve in April 2026 with rise in government expenditure.
Fixed Income Outlook –
Indian markets have closed fiscal year 2026 in a regime of higher yields, elevated volatility and slightly receding but still robust foreign exchange reserves, shaped by global geopolitical shocks, tariff related uncertainty and a structurally strong domestic growth backdrop.
The benchmark 10-years yield which was already reeling under pressure post higher than expected gross borrowing numbers became more vulnerable post the geo-political crisis and its ramifications on higher oil prices, disruptions in existing logistics related to energy causing delays and really volatile USD/INR anticipating pressure on current account. The benchmark yields in fact rose approx. 30 bps over March 2026 itself causing 10-years benchmark to close the year at slightly above 7% levels. Similarly, we witnessed the longer end and the SDL also registering rise in yields during the month closing the fiscal at approx. 7.75% to 8.00%. The short to medium end of the curve, remained relatively better anchored, supported by durable liquidity and RBI’s continued focus on transmitting past rate cuts through OMO’s and forex swap operation.
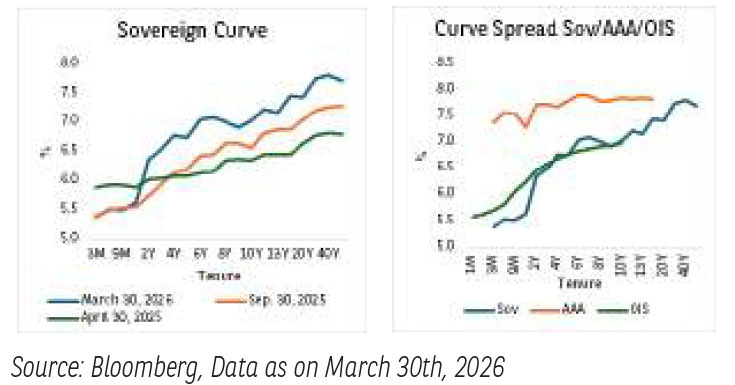
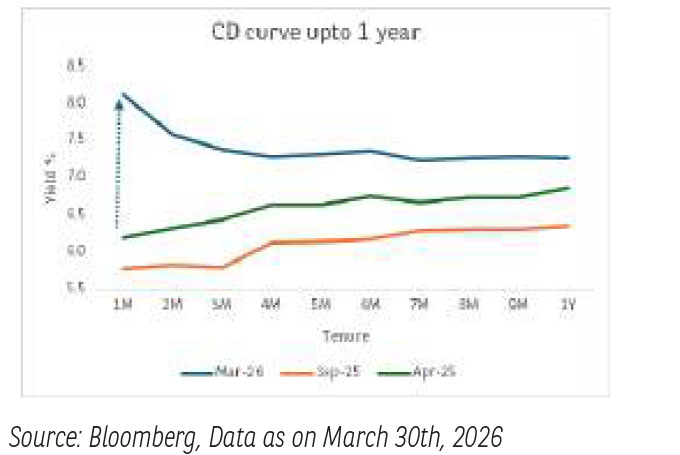
The money market curve also witnessed some hardening despite continuous liquidity support by RBI over last couple of months. We witnessed flatness on the yield curve with 3 -6 months almost flat to inverted to curve up to one year with levels trading in the range of 7.25% to 7.75% with Repo rate hovering at 5.25% the current levels are at an historic spread.
Rupee and FX – Market dynamics:
Through March 2026 the Indian rupee weakened to near record lows, driven by a combination of heavy FPI outflows, a strong dollar and sharply higher crude oil prices triggered by the current geopolitical concern. The rupee’s sensitivity to oil price shocks and global risk sentiment became particularly visible in the first three weeks of March, when long end curve steepened and currency briefly touched fresh lows.
However, positive trade deal signals between India and the US, along with continued strong domestic growth momentum, helped stabilize sentiment towards month end. This led to increase in trading of Fx swaps mainly by the corporate sector leading to elevated volatility and India VIX hovering around 3-years highs.
Through March 2026 India fixed income have moved from an easy liquidity, rate-cut supportive environment into a higher yield, more volatile scenario, with the curve visibly steeper at the long end and cautious positioning at the ultra-longer end tenors. Going forward, taking into account the demand supply situation and the recently announced borrowing calendars details by RBI, we expect a bear flattening scenario between 10 years and ultra long end tenor thereby prompting funds to position for a barbell strategy in their duration portfolios.
We believe in generating alpha through spreads and accruals rather than extreme duration as had been the case over last couple of years accordingly we have reduced duration in our portfolios and concentrated in allocating more into spread and accrual assets and recommend investors and corporates to be more defensive on duration going ahead and till further clarity emerges on the geopolitical front.
The material contained herein has been obtained from publicly available information, believed to be reliable, but Baroda BNP Paribas Asset Management India Private Limited (BBNPPAMIPL) makes no representation that it is accurate or complete. This information is meant for general reading purposes only and is not meant to serve as a professional guide for the readers. This information is not intended to be an offer to see or a solicitation for the purchase or sale of any financial product or instrument. Past Performance may or may not be sustained in future and is not a guarantee of future returns.
Disclaimers for Market Outlook - Equity: The views and investment tips expressed by experts are their own and are meant for informational purposes only and should not be
construed as investment advice. Investors should check with their financial advisors before taking any investment decisions.
The material contained herein has been obtained from publicly available information, internally developed data and other sources believed to be reliable, but Baroda BNP
Paribas Asset Management India Private Limited (BBNPP), makes no representation that it is accurate or complete. BBNPP has no obligation to tell the recipient when opinions
or information given herein change. It has been prepared without regard to the individual financial circumstances and objectives of persons who receive it. This information is
meant for general reading purposes only and is not meant to serve as a professional guide for the readers. Except for the historical information contained herein, statements in
this publication, which contain words or phrases such as ‘will’, ‘would’, etc., and similar expressions or variations of such expressions may constitute forward-looking statements.
These forward-looking statements involve a number of risks, uncertainties and other factors that could cause actual results to differ materially from those suggested by the
forward-looking statements. BBNPP undertakes no obligation to update forward-looking statements to reflect events or circumstances after the date thereof. Words like believe/
belief are independent perception of the Fund Manager and do not construe as opinion or advice. This information is not intended to be an offer to see or a solicitation for the
purchase or sale of any financial product or instrument. The investment strategy stated above is for illustration purposes only and may or may not be suitable for all investors.