Market Outlook
Market Outlook

| October 2026 |
|

|
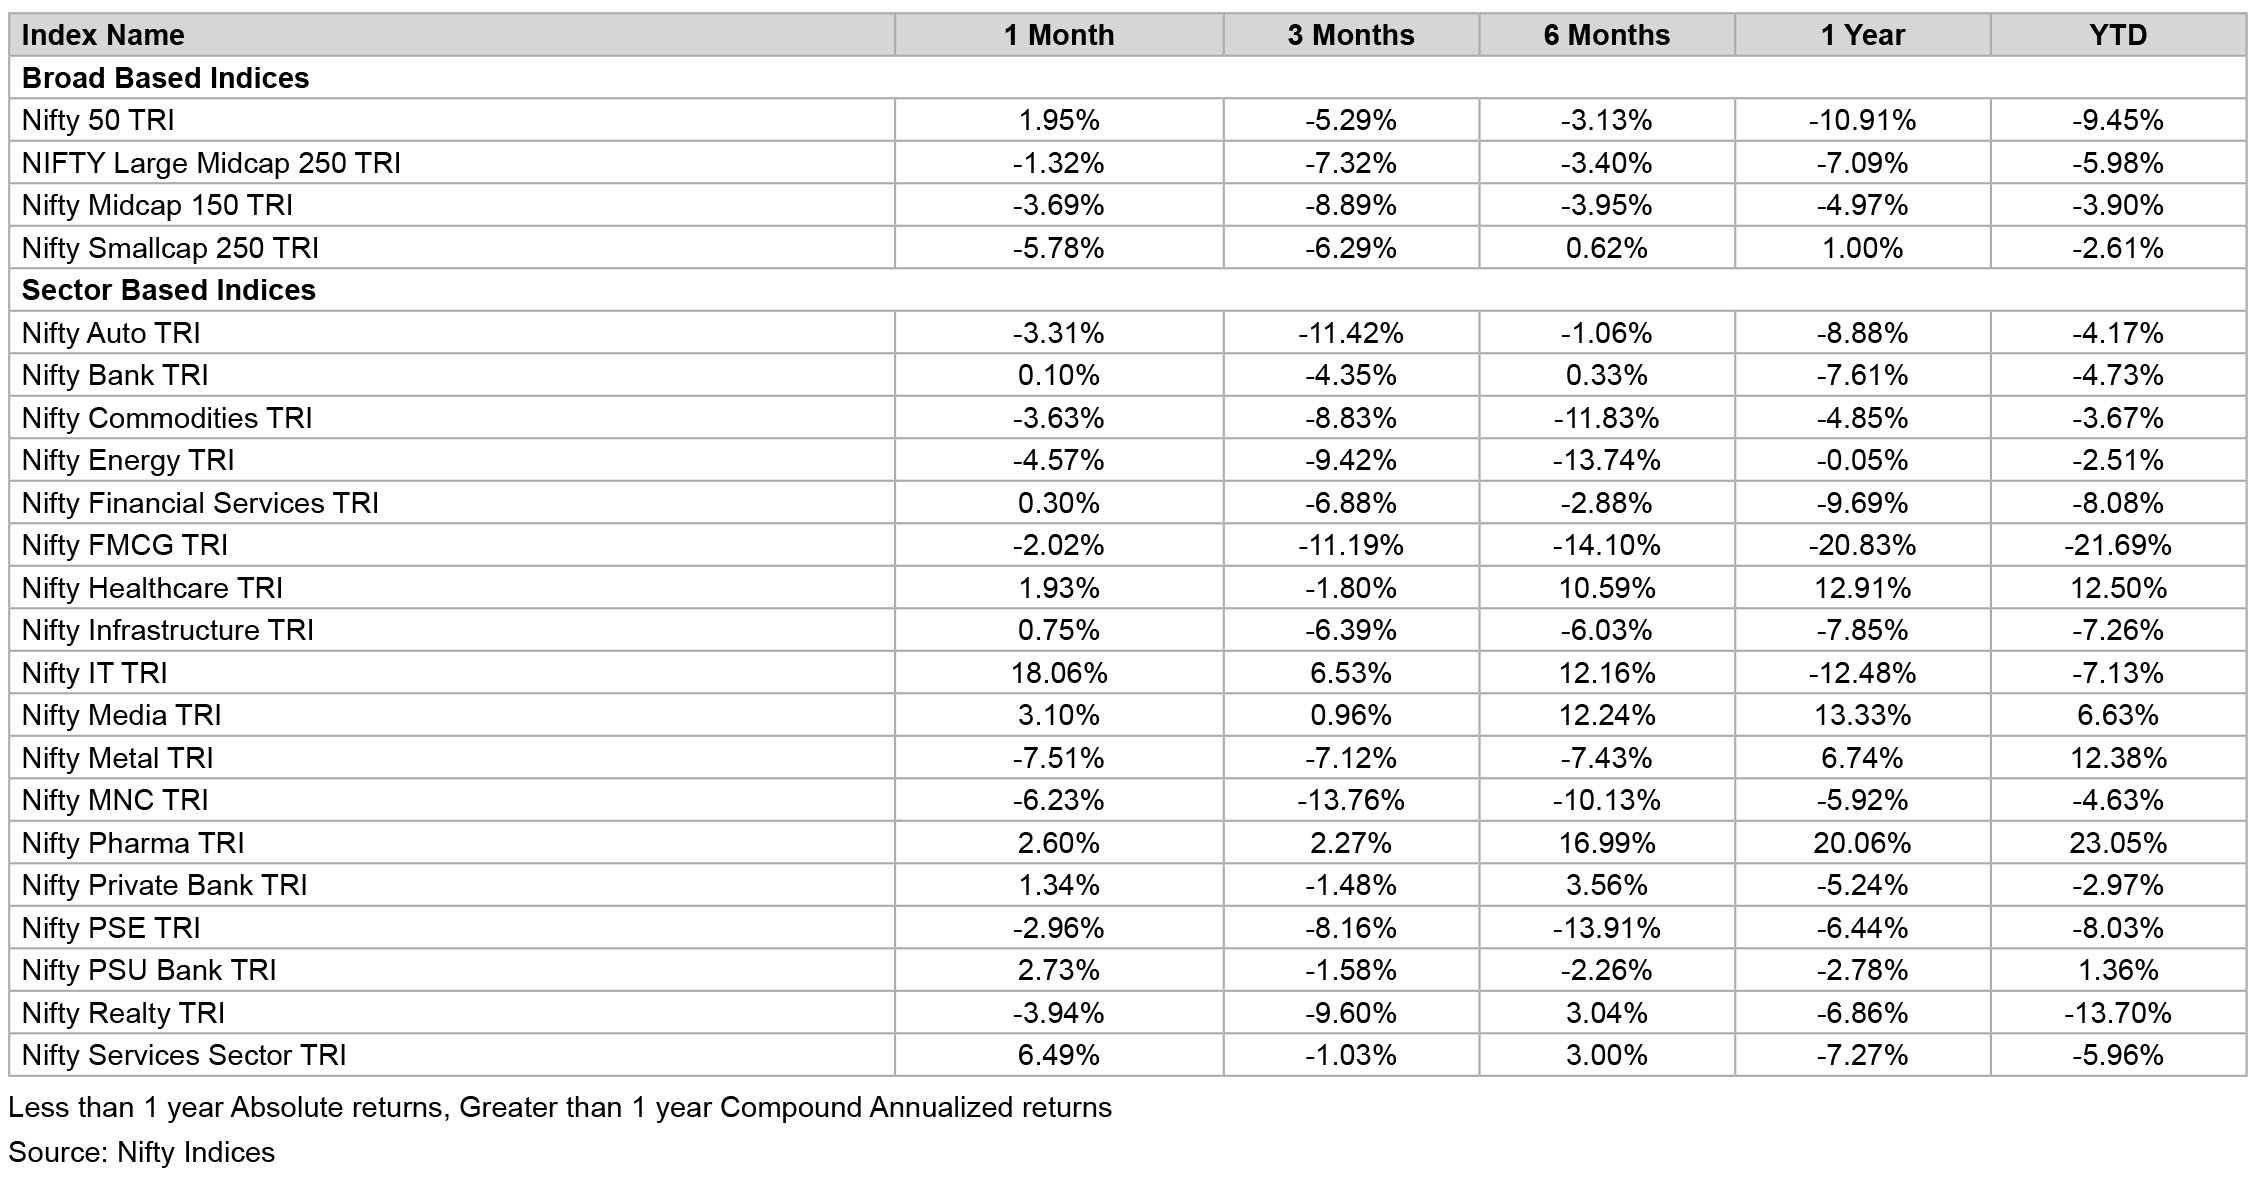
Asian markets were down during the month of October primarily due to sell-off AI theme as investors remain sceptical over profitability of massive artificial intelligence (AI) investments, and elevated energy costs driven by ongoing conflicts in the Middle East. Chinese and Hong Kong were further impacted by weak domestic consumption and factory slowdown. Korean index KOSPI saw the most fall (-16.2%) during the month, followed by Chinese index SSE Composite (Shanghai Stock Exchange) which was down by 6.3%, Taiwan Index (-5.7%), Hong Kong’s Hang Seng (-5.4%) and Japanese market NIKKEI 225 (-5.2%).
Developed European economies fared relatively well during the month. German index DAX was up by 2.5% driven by upgrade in economic growth forecast, improved business sentiment, and resilient manufacturing activity. FTSE 100 Index (UK) was up by 1.2% while French CAC 40 index was largely flat. US index Dow Jone was up by 1.7% for the month as investors moved away from AI theme stocks to traditional, defensive, and value-oriented sectors. S&P 500 was down by 0.9%.
During the month, mid and small cap index underperformed the broader market primarily on account of rich valuations with Nifty Small Cap 250 Index down by 5.8% and Nifty Midcap 150 Index by 3.7%. Within sectoral indices all the sectors ended in red, expect for tech and healthcare with BSE IT Index significantly outperforming other sectors and is up by 14.8% during the month followed by BSE Tech (+14.5%) and BSE Healthcare (+0.2%). BSE Capital Goods (-7.2%) corrected the most in October 2026 followed by BSE Metals (-6.8), BSE Consumer Durables (-4.9%), BSE Power (-4.3%), BSE Realty (-4.3%), BSE Auto (-3.8%), BSE FMCG (-2.9%), BSE Oil & Gas (-2.3%) and BSE Banks (-0.5%).
Foreign institutional investors (FII) continued to remain net sellers in the month on account of elevated crude oil prices and high valuation concerns, with net outflows of USD 2.6bn. Barring Brazil, which saw 2nd consecutive month of net inflows of USD 1.8bn, all other key emerging economies saw FII outflows. Taiwan saw intense FII selling of USD 31.8bn in October after USD 2.3bn selling last month, flowed by South Korea (-USD 14.6bn), Indonesia (-USD 936mn), Vietnam (-USD 915mn) and Malaysia, Thailand and Philippines saw outflow to the tune of USD 236-197mnmn. Taiwan and South Korea were impacted primarily due to concerns on AI theme.
With regards to domestic institutional flows, Indian mutual fund industry grew by ~9% YoY, however declined by ~5% MoM to INR 82.64L crore in September 2026*. The decline was on account of massive outflow of INR 1.33L crore in debt funds and equity market correction. Equity flows were strong during the month at INR 383.06bn in August from INR 293.29bn in August (+30%). Large cap funds rebounded in September with net inflows of ~INR 8.5bn as against net outflows of INR 11.47bn last month. Flows in mid and small cap remained healthy, growing 12.1% and 13.4% MoM respectively. Systematic Investment Plans (SIP) too continues to be strong at INR 324.9bn as against INR 322.97bn in August. Positioning wise financials, healthcare, communications and materials were the key sectors in terms of inflows, while IT and industrials saw the most outflows.
Sectorally, large private banks have showed strong business growth amidst FCNR (B) scheme. Also, the Repo rate cycle is expected to provide tailwind to margin. This will benefit both Large Private and PSU Banks as majority of their loans are on floating rate. Capital Markets sector is facing headwinds as the markets have been under pressure for some time lately. Communications segment is doing fairly well, primarily on account of IPO of a large telecommunication company. In the auto space, demand remains healthy led by GST benefit, which was announced last year, however growth will taper down hereon on account of high base of last year. This is also having a positive trickle-down impact on auto ancillary industry. While tailwinds persist in the sector, higher commodity prices will impact profitability of auto companies, while for ancillary companies it will be passed on. The IT sector has seen sharp rally in the recent months, largely on account of Anti AI theme and positive surprise in the recent earnings season. However, due to structural challenges around AI led disruption in the industry, sentiments remain bleak.
With quarterly earnings underway for corporate India, initial readthrough has been positive with 231 of NSE 500 companies reporting Sales/PAT growth of 24%/25% respectively. Ex-Energy PAT grew 23% in both large and mid-caps companies, while small caps delivered 55% growth, aided partly by low-base and concentrated gains. The feared Q2 earnings setback has therefore not materialised. Rapid repricing, relatively benign credit costs and the partial pass-through of September's crude shock helped companies absorb cost pressures. The test shifts to Q3, particularly for cement, automobiles and other commodity-consuming businesses. At current levels Nifty 50 is trading at 19.3x trailing P/E, well below its historic average.
Source: Kotak Securities, HSBC, Motilal Oswal Securities, Elara, Industry reports. Data as on October 31, 2026
*Mutual Fund industry data is published during mid-month
India’s fixed income market adjusted to a firmer monetary policy stance in October as the Reserve Bank of India (RBI) delivered a 25 bps repo rate hike to 5.50%. Domestic rates experienced an upward repricing across shorter maturities, reflecting the policy action, persistent energy prices with Brent crude trading above $110/bbl, seasonal currency demand, and an increase in US dollar forward premiums. The sovereign curve saw marked bear-flattening, with 1- to 2-year yields advancing by ~57–60 bps during the month, whereas intermediate and long-dated paper moved up more moderately. Globally, the external rates environment showed signs of stabilization toward month-end as the US Federal Reserve maintained a policy pause and US Treasury yields eased off their cycle highs. However, domestic liquidity tightening and inflation caution limited the scope for local duration to participate in this external relief, keeping portfolio strategy oriented towards front-end carry and disciplined duration positioning.
Sources: Cogencis; Bloomberg; RBI; US Federal Reserve. Data as on October 30, 2026.
Global Rates: Fed on Pause as US Yields Ease off Peaks
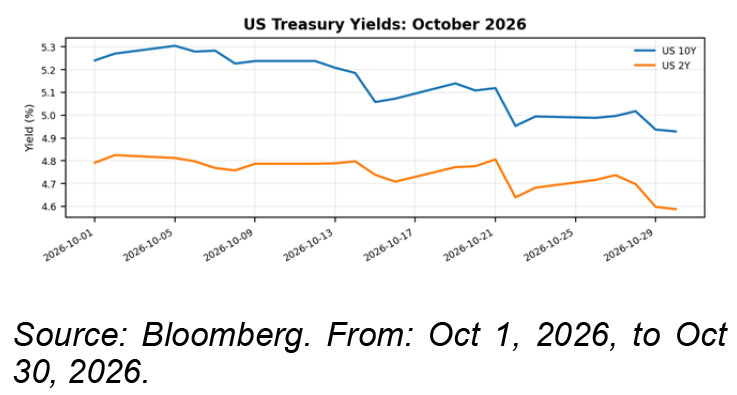
Global central banks adopted an observational posture during October following the synchronized tightening delivered in September 26. After lifting the federal funds target range by 25 bps to 3.75%–4.00% in September, the Federal Reserve held rates steady at its late-October meeting to evaluate the ongoing economic impact of tighter credit conditions and higher real yields.
This policy pause catalyzed a turnaround in US sovereign bonds. The US 10-year Treasury yield, which had surpassed 5.20% earlier in the month, softened back into the 4.85%–4.95% range by late October as financial markets consolidated expectations of a sustained plateau in US rates. Similar pauses across other major central banks helped steady cross-border capital flows. For domestic debt managers, while the softening in US benchmark yields reduced the risk of imported rate volatility, it did not provide sufficient impetus to extend duration locally, where domestic policy tightening and commodity inputs remained the primary drivers.
RBI Moves to Calibrated Tightening as Inflation Risks Re-emerge
The RBI’s October 5–7 MPC meeting marked a clear shift in the policy backdrop. The Committee raised the policy repo rate by 25 bps to 5.50% and changed its stance from neutral to calibrated tightening. The SDF rate was adjusted to 5.25%, while the MSF and Bank Rate moved to 5.75%. The Governor highlighted that rate cuts were off the table in the near term, with future action dependent on the evolution of underlying inflation, second-round effects and demand conditions.
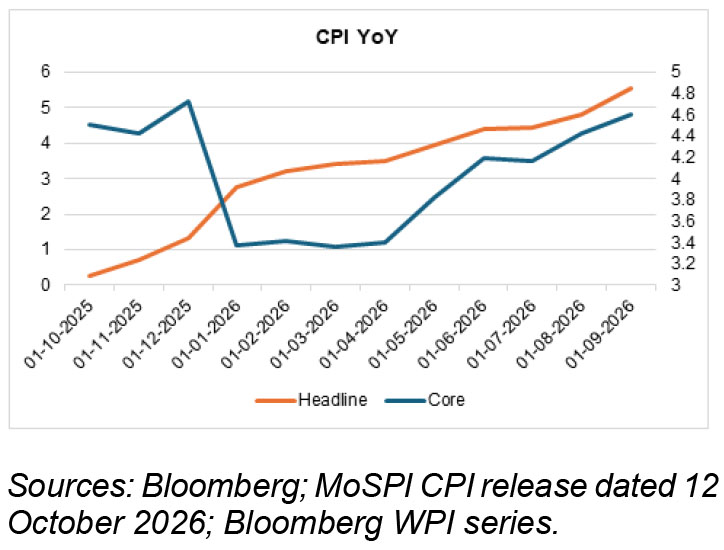
The policy decision came against a renewed rise in domestic price pressures. September headline CPI increased to 5.54% from 4.83% in August, while core CPI rose to 4.60% from 4.43%. WPI inflation also moved higher to 11.39% in September from 9.92% in August. The acceleration in both consumer and wholesale inflation, together with the sharp rise in crude during October, reduces the scope for a quick reversal in the policy stance.
Growth remains a counterweight to the inflation concerns. India recorded real GDP growth of 7.8% for Q1FY27, while credit growth was at 18.23% and deposit growth 16.72% as of 18th October. Resilient activity and strong credit aggregates provide RBI with room to prioritise inflation control over near-term growth support.
Liquidity Dynamics: Festive Cash Drain and Forward Premiums Tighten Conditions
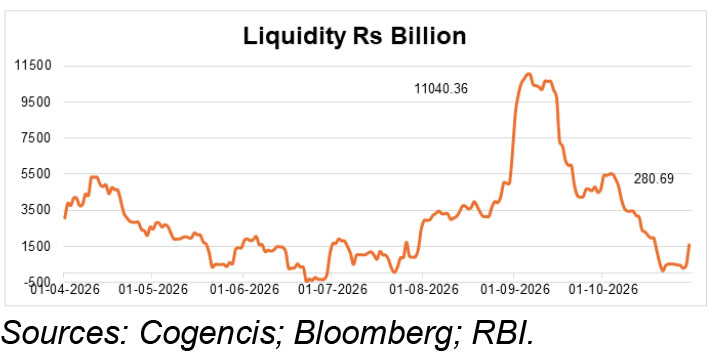
Banking-system liquidity trended tighter through October due to a confluence of seasonal currency demand, tax outflows, and foreign exchange dynamics. While approximately ₹1.43 lakh crore of long-tenor VRRR operations matured in early October, the liquidity was absorbed by structural cash drains. Currency in circulation (CIC) expanded noticeably ahead of the festive season, drawing primary reserves out of the banking sector at a time when credit growth continued to outstrip deposit accretion.
A key contributor to wholesale funding pressures was the widening of US dollar/rupee forward premiums over the month. Higher forward premiums may have led to arbitrage with domestic rates which banks may have access. Consequently, commercial banks turned to domestic certificate of deposit (CD) issuances to meet their balance sheet and credit requirements, adding supply to money markets. The RBI maintained fine-tuning operations to keep overnight rates anchored near the upper bound of the policy corridor, reinforcing the upward shift in front-end money market yields.
USD/INR: Currency Stabilizes After Initial Oil-Driven Volatility
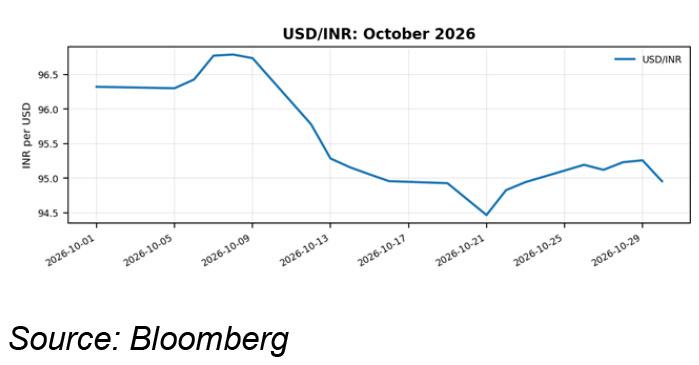
The rupee exhibited relative stability over October, absorbing external pressures from elevated oil prices and broader dollar strength. USD/INR opened the month around 96.32 and reached an intra-month peak of 96.78 on October 8 as Brent crude advanced.
Consistent two-way market interventions by the RBI across spot and forward desks contained speculative pressure and smoothed market adjustments. Supported by the domestic rate hike and exporter sales, the currency recovered, strengthening to an intra-month low of 94.46 on October 21 before closing at 94.95. This represented a net appreciation of 88 bps compared to September's finish of 95.83, reflecting solid external buffers. Nonetheless, sustained triple-digit crude prices remain an ongoing monitorable for the trade deficit.
Brent Crude: Elevated Energy Benchmarks Anchor Inflation Risk Premia
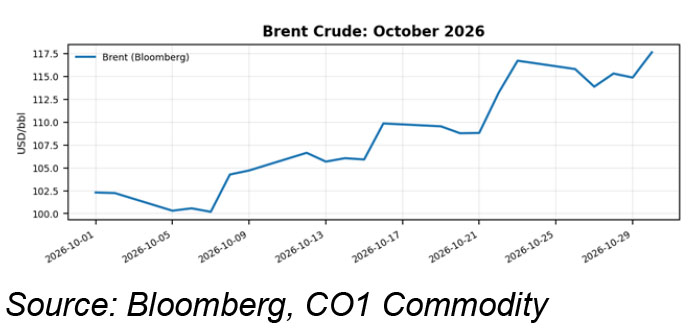
Crude oil benchmarks remained elevated throughout October. Brent crude rose from $97.84/ bbl at the end of September ($102.17/bbl on October 1) to an intra-month high of $116.83/bbl on October 23, before settling at $112.27/bbl. WTI crude displayed a comparable trajectory, moving from $89.97/bbl to an intra-month peak of $103.38/ bbl, ending at $102.85/bbl.
The persistence of Brent crude above $110/ bbl supported the RBI's decision to maintain an active disinflationary bias. Elevated energy costs sustain upside risks for retail inflation and logistics, maintaining a baseline risk premium across domestic fixed income that discourages aggressive duration extension.
G-sec and T-bill Curve: Bear-Flattening Shifts Relative Value to the Belly
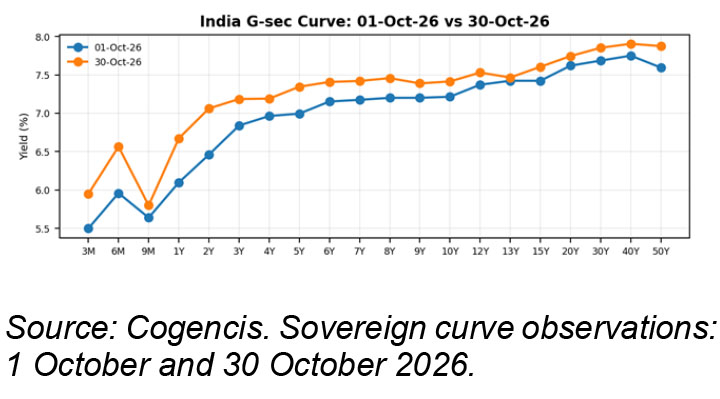
October’s yield curve dynamics were defined by a pronounced bear-flattening as the front end absorbed the 25 bps rate hike, hawkish MPC minutes, and system cash tightness. Benchmark 1-year and 2-year G-sec yields rose by 57 bps (to 6.67) and 60 bps (to 7.06%) respectively, mirrored in money markets where 3-month and 6-month T-bill cut-offs advanced by 45 bps (to 5.95%) and 60.5 bps (to 6.57%). In contrast, longer tenors were more stable: the 5-year yield rose 35 bps to 7.35%, the 10-year benchmark moved up 20 bps to 7.41%, and 30-year yields ended 17 bps higher at 7.85%. Consequently, the 1Y–10Y curve slope flattened by 38 bps to 74 bps, while the 2Y–10Y spread compressed by 40 bps to just 35 bps.
From a portfolio allocation standpoint, this flattening has altered the risk-reward equation across tenors. Extending duration from 2 years out to 10 years currently yields only 35 bps of incremental spread—an inadequate cushion against potential commodity shocks and supply absorption risks. Rather than adding unhedged long duration, the curve now Favors intermediate maturities. The 3- to 5-year belly (yielding 7.19%– 7.35%) offers an optimal combination of absolute yield and defensiveness, capturing roll-down gains into the steeper short end without the capital volatility of the long end. However, we also favour 10 year point from tactical trading perspective.
The 10-year benchmark closed at 7.41%, up from 7.21% at the start of October. The continued rise in intermediate yields, alongside a comparatively smaller move at the long end, has steepened the policy repricing into the belly. The higher absolute yield level improves prospective carry, but volatility around the new policy stance argues for staggered entry points rather than a broad duration extension.
FBIL CD Curve: Elevated Absolute Yields, but Funding Costs Have Reset Higher
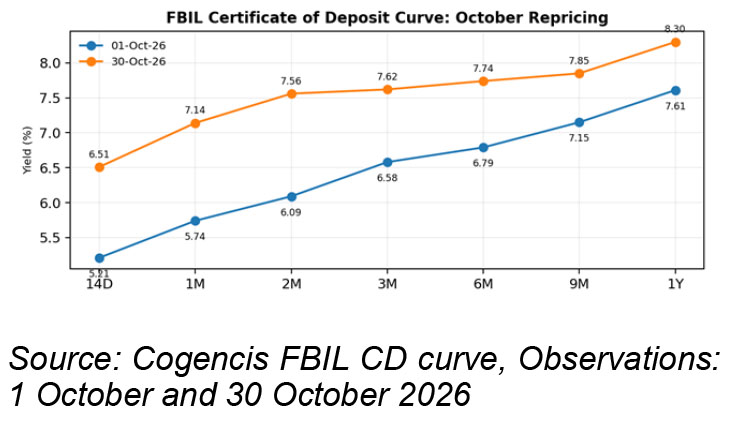
The FBIL (Financial Benchmarks India Private Ltd.) CD curve moved sharply higher across tenors during October. The 1-year rate increased by around 69 bps to 8.30%, while the 6-month rate increased by around 95 bps to 7.74%, and the 3-month rate rose by around 104 bps to 7.62%. The CD repricing reflects RBI’s policy-rate increase, banks’ own deposit and liquidity positions, and tenor-specific supply-demand conditions. A further source of pressure may have come from the sharp rise in USD/INR forward premiums during October. Higher forward premiums make it more expensive for participants to hedge dollar funding into rupees, reducing the relative economics of swapped foreign-currency funding and potentially increasing reliance on domestic wholesale funding, including CDs. This provides a plausible channel linking FX hedging costs with domestic CD pricing, alongside the RBI rate increase and changes in surplus liquidity.
This repricing creates an advantageous accrual opportunity for low-duration and money market strategies. At 8.30%, the 1-year bank CD segment enables investors to lock in high-quality carry well above the policy rate, providing an appealing riskadjusted return while avoiding duration exposure in an uncertain macro environment.
PSU AAA Corporate Bonds: Defensive Carry and Roll-Down
The PSU AAA curve offers meaningful absolute carry over the sovereign curve, particularly in the 1–3 year segment. The 1-year PSU AAA yield is around 8.25%, compared with a 1-year G-sec yield of 6.67%, implying a spread of approximately 158 bps. At 2 years, the yield is 8.34% with a spread of around 128 bps; at 3 years, the yield is 8.33% with a spread of around 114 bps. The spread cushion narrows as maturity extends, while the short-to-intermediate segment retains a relatively attractive carry-and-roll profile.
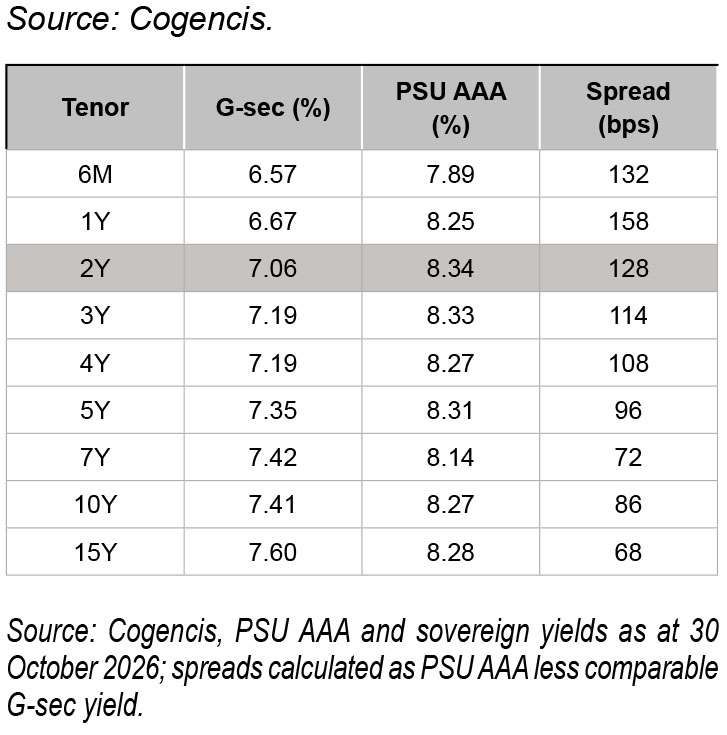
We prefer high-quality 2–5 year PSU AAA exposure for defensive carry and roll-down, subject to issuer-level credit assessment and secondary-market liquidity. Longer-duration corporate exposure should remain selective given the higher sensitivity to any further rise in term premium and funding costs.
Outlook
Our investment stance across Indian fixed income remains anchored in carry and accrual, with a defensive and selective approach to outright duration. October’s rate hike and front-end repricing have elevated nominal yields across money markets and short corporate bonds to attractive levels, but the combination of tripledigit crude prices, tight banking liquidity, and an alert central bank warrants patience on duration extension.
In the 6-month to 1-year money market segment, elevated rates on 1-year bank CDs (8.30%) and short PSU AAA paper (8.25%) offer an effective anchor for short term portfolios, allowing them to harvest high-quality accrual with minimal mark-to-market risk. For short- and medium-duration funds, the 3- to 5-year sovereign and corporate segment (yielding ~7.20%–7.35% in G-sec and ~8.30%–8.34% in AAA corporates) represents the preferred maturity band, delivering a balanced coupon buffer and predictable roll-down potential.
At the long end of the curve, positioning remains tactical. With the 10-year benchmark at 7.41% and 30- to 50-year yields near 7.85%–7.87%, the flat curve profile does not offer compelling risk-adjusted value given prevailing commodity headwinds. We prefer to maintain liquidity and wait for supply-driven yield concessions or a sustained cooling in global crude benchmarks before extending portfolio duration. Key monitorable for November include post-festive currency reflux into the banking system, crude price stability below $100/bbl, global yield movements following the Fed's pause, and the trajectory of domestic CPI inflation. Overall, the portfolio posture remains cantered on earning high-quality carry while retaining flexibility.
Source- Bloomberg, RBI, MOSPI, TMA, Data latest available as on October 30, 2026
The material contained herein has been obtained from publicly available information, believed to be reliable, but Baroda BNP Paribas Asset Management India Private Limited (BBNPPAMIPL) makes no representation that it is accurate or complete. This information is meant for general reading purposes only and is not meant to serve as a professional guide for the readers. This information is not intended to be an offer to see or a solicitation for the purchase or sale of any financial product or instrument. Past Performance may or may not be sustained in future and is not a guarantee of future returns.
Disclaimers for Market Outlook - Equity: The views and investment tips expressed by experts are their own and are meant for informational purposes only and should not be
construed as investment advice. Investors should check with their financial advisors before taking any investment decisions.
The material contained herein has been obtained from publicly available information, internally developed data and other sources believed to be reliable, but Baroda BNP
Paribas Asset Management India Private Limited (BBNPP), makes no representation that it is accurate or complete. BBNPP has no obligation to tell the recipient when opinions
or information given herein change. It has been prepared without regard to the individual financial circumstances and objectives of persons who receive it. This information is
meant for general reading purposes only and is not meant to serve as a professional guide for the readers. Except for the historical information contained herein, statements in
this publication, which contain words or phrases such as ‘will’, ‘would’, etc., and similar expressions or variations of such expressions may constitute forward-looking statements.
These forward-looking statements involve a number of risks, uncertainties and other factors that could cause actual results to differ materially from those suggested by the
forward-looking statements. BBNPP undertakes no obligation to update forward-looking statements to reflect events or circumstances after the date thereof. Words like believe/
belief are independent perception of the Fund Manager and do not construe as opinion or advice. This information is not intended to be an offer to see or a solicitation for the
purchase or sale of any financial product or instrument. The investment strategy stated above is for illustration purposes only and may or may not be suitable for all investors.