Market Outlook
Market Outlook

| September 2026 |
|

|
Asian markets performance was a mixed bag with Taiwan Index rallying the most during the month, up by 3.9%, followed by Japanese market NIKKEI 225 (+0.7%) and South Korean index KOSPI (+0.3%) aided by continued positive momentum in semi-conductor and Artificial Intelligence (AI) theme. The Chinese index SSE Composite (Shanghai Stock Exchange) and Hong Kong’s Hang Seng ended in red, down by 3.6% and 3.7% respectively on account of slowing economic growth indicators, fragile domestic consumption, and a sharp selloff in property stocks. Amongst other indices, Brazil was the best performing market up by 4.8%. Australia was down by 3.2%, Thailand by 2.3% and Singapore by 1.4%.
Performance of developed European economies was weak with all major indices ending in red for the month. French CAC 40 index was down the most by 4.2%, followed by German index DAX (-3.7%) and FTSE 100 Index (UK) down by 1.6%. The weakness was on account of surging sovereign bond yields, higher inflation due to rising crude prices. US index Dow Jone was down by 3.4% for the month led by increasing bond yields and higher crude prices. S&P 500 was largely flat during September 2026, up marginally by ~0.4%.
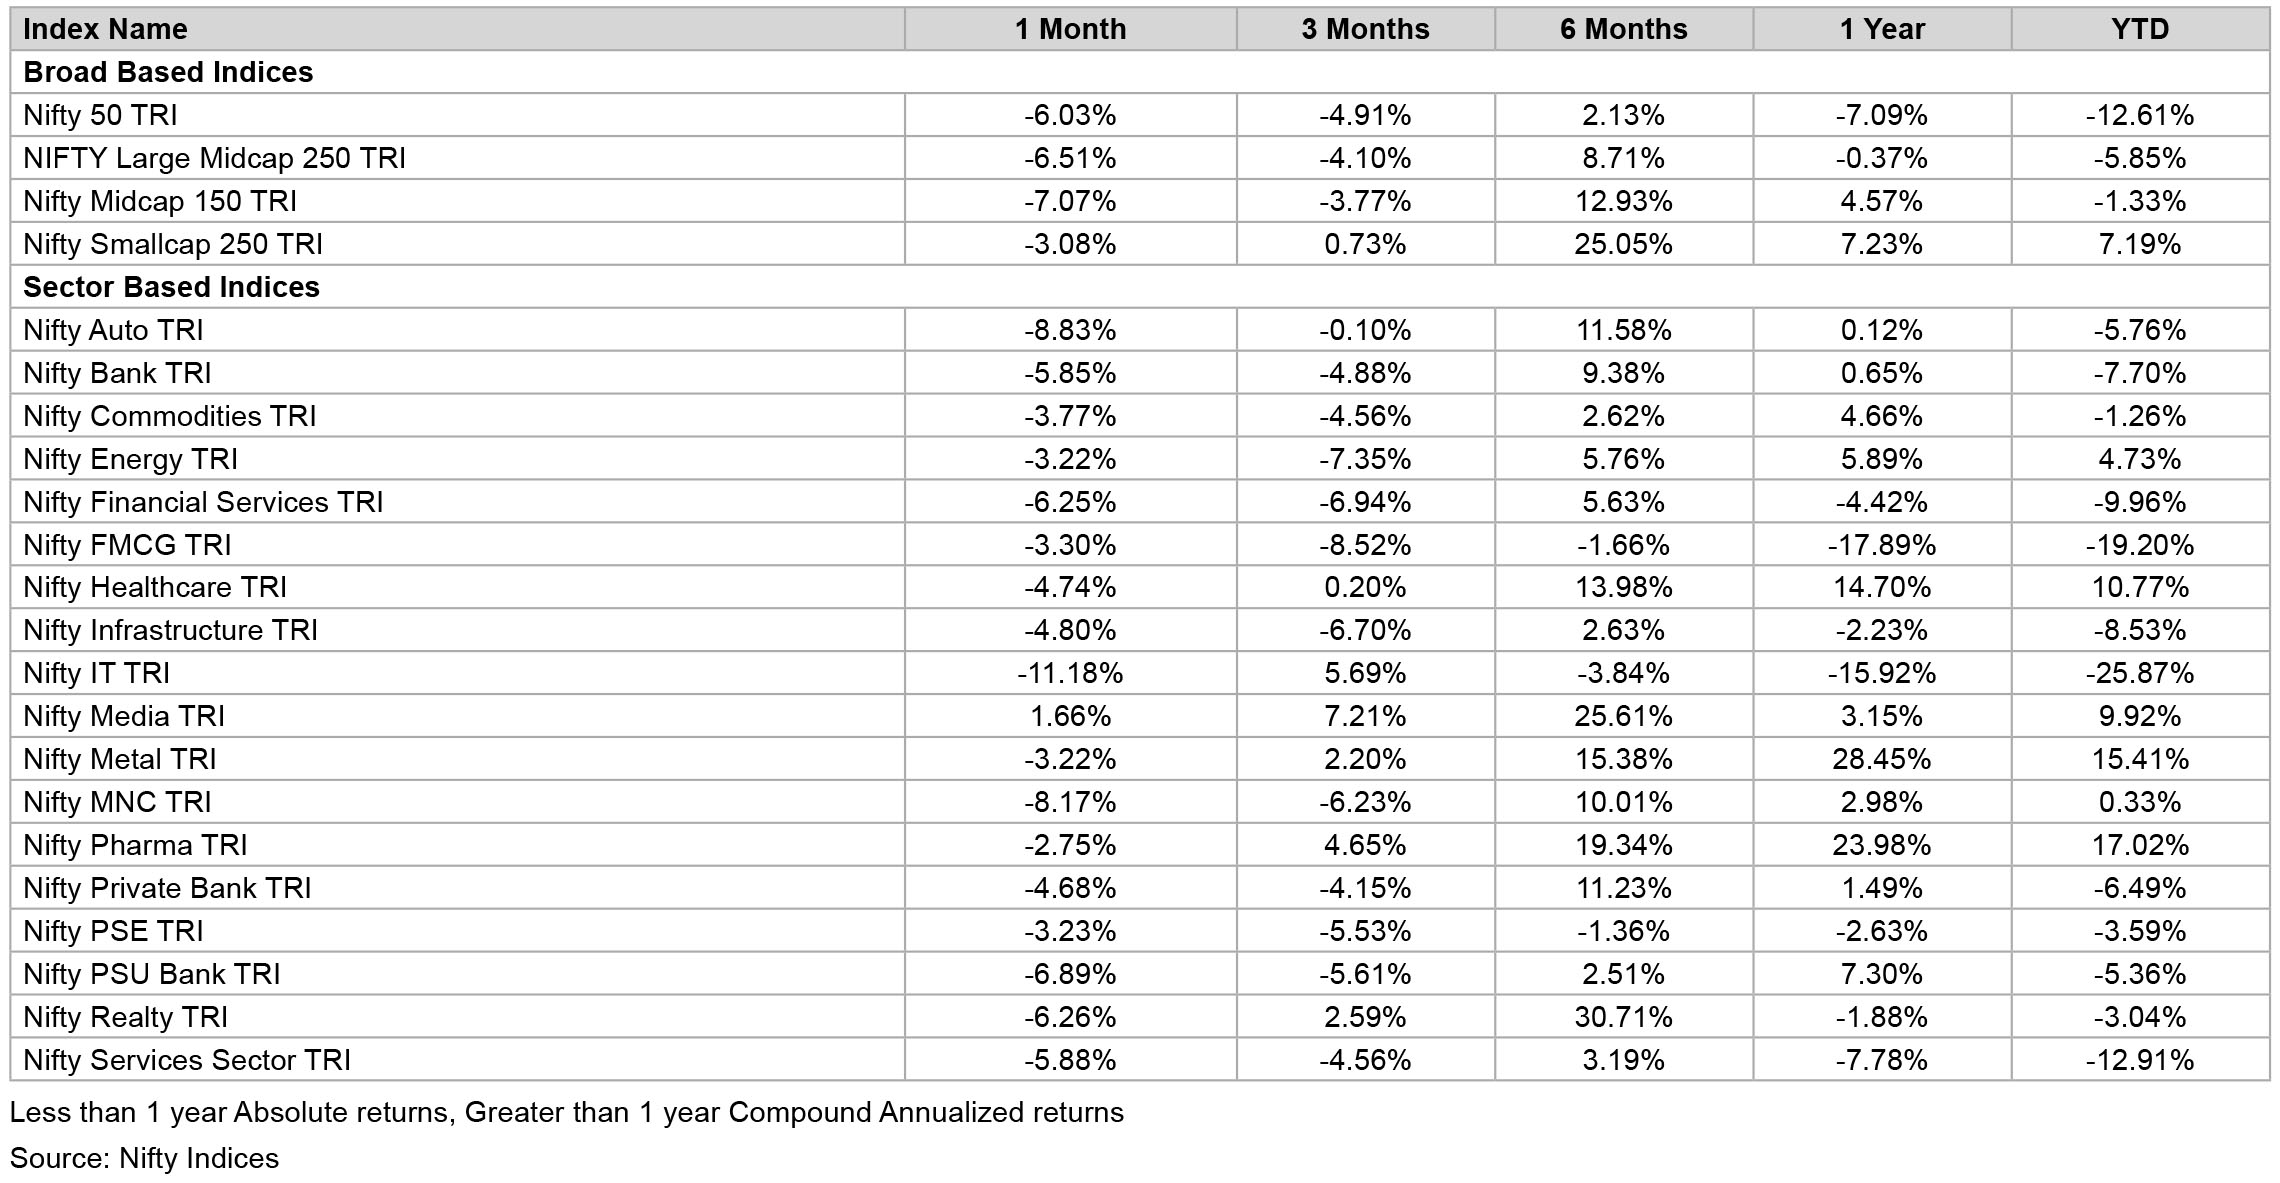
During the month, although mid and small cap index were negative, outperformed the broader market with Nifty Small Cap 250 Index down by 3.1% and Nifty Midcap 150 Index by 7.1%. Within sectoral indices all the sectors ended in red with IT (-10.1%) being the top underperformer, followed by BSE Consumer Durables (-9.5%), BSE Auto (-8.8%), BSE Capital Goods (-6.5%), BSE Consumer discretionary (-6.1%), BSE Real Estate (-5.7%), BSE Banks (-5.3%), BSE Oil (-4%), and BSE Healthcare (-2.9%).
After a brief two-month period of positive flows, Foreign institutional investors (FII) again turned negative with net outflows of USD 3.2bn amid rising US bond yields and elevated crude prices. Amongst emerging economies, only Brazil saw new inflows to the tune of USD 1.9bn. South Korea saw the highest outflow of USD 16.9bn, followed by Taiwan (-USD 2.3bn), Thailand (-USD 780mn), Indonesia (-USD 574mn), Malaysia (-USD 360mn) and Philippines (-USD 134mn).
With regards to domestic institutional flows, Indian mutual fund industry grew by 15.8% YoY and 1.5% MoM with net asset of INR 87.08L crore in August 2026*. Equity flows continue to be net positive at INR 293.29bn in August from INR 246.97bn in July. Large cap funds saw second consecutive month of net outflows of INR 11.47bn as investors move towards high momentum mid and small cap funds. Flows in mid and small cap remained healthy, growing 12.9% and 2.6% MoM respectively. Systematic Investment Plans (SIP) too continues to be strong at INR 322.97bn in August growing 1.1% MoM and 14% YoY. Positioning wise healthcare, financials, materials were the key sectors in terms of inflows, while IT and utilities saw the most outflows.
The pharmaceutical industry continues to serve as a high-growth sector, demonstrating strong resilience against prevailing geopolitical headwinds. Steady domestic formulation demand combined with cost-competitive manufacturing capabilities further reinforces India's position as a pivotal global export powerhouse. In the Financial space, Foreign Currency Non-Resident Bank (FCNR) (B) swap facility garnered ~$127bn deposits (~4.8% of system deposits) into the banking system which along with rate hike expectations builds positive case for banks as these two policy measures are expected to be earnings and growth accretive.
On the macro front, geo-political tension continues which has further led to increase in crude prices which is up by 6-8% in the past one month to ~USD 100/barrel. Weak monsoon season is also weighing on markets as India faces ~13% rainfall deficit and certain states declaring drought like conditions. These issues will likely lead to inflationary situation in 2HFY27 and probable demand pressure primarily from rural India. Globally, central banks are increasing interest rates, with the US Fed raising rates by 25bps to 3.75-4%. Similar hike has been taken by European Central Bank and Bank of Japan, which is one of the reasons for FII sell-off seen during the month.
As corporate India gears up for the upcoming earnings season, key variables to watch out for will be the impact of inflation on profitability. On the financial side, this quarter is likely to see strong growth aided by FCNR policy which will aid in earnings growth. IT companies will again see softness in demand, despite being a seasonally strong quarter, as macro pressures, interest rate hikes, AI-related disruptions, and geopolitical overhang continue to weigh on discretionary spending and decision-making cycles. On the Industrial segment, though execution remains strong, key to look out for will be the impact of rising cost due to West Asia war. Overall, for Nifty 50 companies, earnings are likely to remain healthy, with concerns on margins. At current levels, Nifty 50 is trading at 19.4x trailing P/E, well below its historic average.
Source: Kotak Securities, HSBC, Motilal Oswal Securities, Industry reports. Data as on September 30, 2026
*Mutual Fund industry data is published during mid-month August
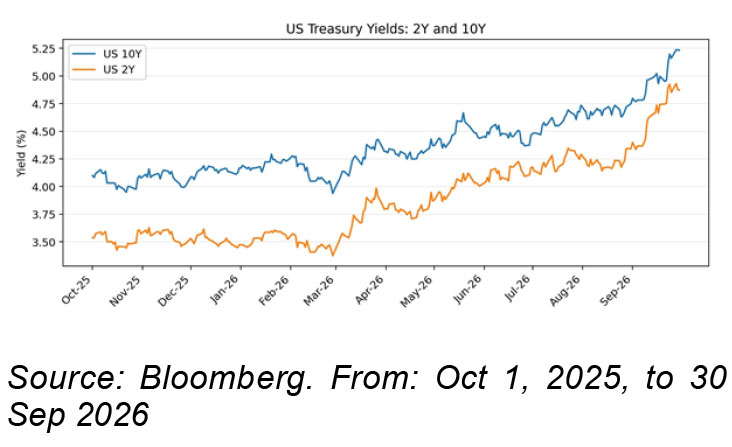
India’s fixed income market enters October with the balance of risks shifting further towards higher-for-longer rates. September saw a broad repricing across domestic rates as global bond yields rose sharply, major central banks tightened policy, crude oil remained elevated and domestic inflation moved higher. The Federal Reserve and European Central Bank (ECB) raised policy rates by 25 bps, while the Bank of Japan also raised rates by 25 bps. The global rates backdrop has therefore become materially less supportive for duration, while domestic inflation and liquidity dynamics have also turned less benign.
Sources: Bloomberg; Federal Reserve; ECB; Bank of Japan. September 16, 2026
Global Tightening and Higher Term Yields Raise the Duration Hurdle
September marked a meaningful shift in the global rates environment. The Federal Reserve raised the federal funds target range by 25 bps to 3.75%-4.00% on September 16, 2026 while the ECB also raised rates by 25 bps. On September 19, the Bank of Japan raised its policy rate by 25 bps to 1.25%. Against this backdrop, global bond yields moved sharply higher, with the US 10-year Treasury touching 5.24% on September 29, 2026, its highest level since 2007, while the 10-year JGB (Japanese Government Bond) touched 3.12% on September 25, 2026, the highest level since 1996. The rise in global term yields increases the hurdle for a sustained decline in Indian long-end yields and reduces the relative yield cushion available to foreign investors.
Domestic Inflation and RBI Reaction Function
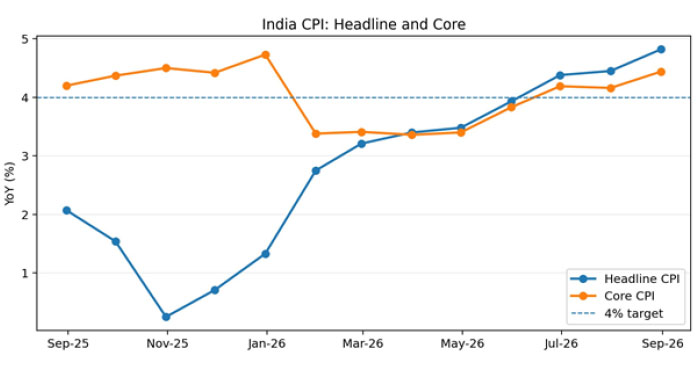
Domestic inflation moved higher in August, with headline CPI at 4.82% and core CPI at 4.44%, compared with 4.45% and 4.16% respectively in June and July. The combination of higher inflation, elevated crude prices and resilient domestic growth reduces the room for further monetary accommodation. The September repricing indicates that the market is increasingly preparing for a shift from the earlier easing cycle toward a potential tightening phase.
One-year OIS (Overnight Index Swap) is at 6.27% and 5-year OIS is at 6.73%. The 1-year OIS is around 102 bps above the 5.25% repo rate, while the 5-year OIS is around 148 bps above repo. The gap indicates that market pricing remains materially above the current policy rate, although OIS levels also incorporate term and risk premia.
Sources: Bloomberg; Cogencis. Data as on September 30, 2026.
Liquidity Transitions from Surplus to Tighter Conditions
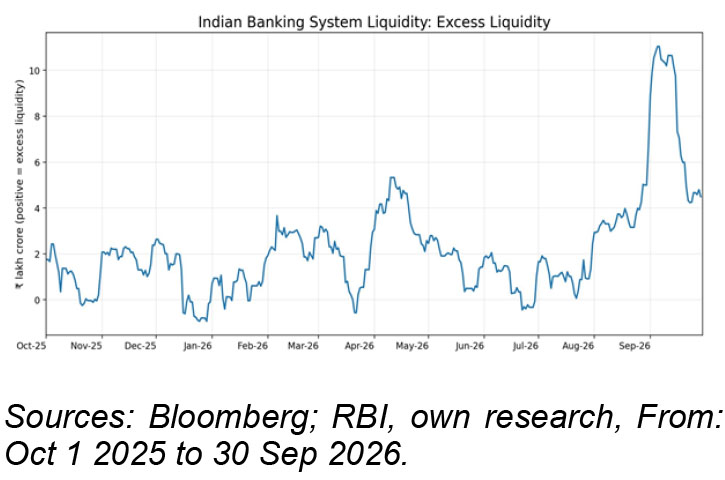
Banking-system liquidity reduced materially through September as the RBI actively absorbed surplus funds. Quarter end GST and income-tax outflows added to the natural liquidity drain, while the RBI conducted overnight and longer tenor VRRR (variable rate reverse repo) operations and completed ₹1 lakh crore of OMO (open market operation) sales. The combination of active RBI intervention and tax-related outflows brought the liquidity surplus down substantially from the levels seen earlier in the month.
Banking-system liquidity remained in surplus through September, although the excess liquidity declined materially from the peak reached earlier in the month. On the Bloomberg banking-liquidity measure, excess liquidity was around ₹4.5 lakh crore on September 29, 2026 down sharply from the September peak. The reduction reflects active RBI absorption alongside quarter-end GST and income-tax outflows, but the system remained in excess liquidity rather than moving into deficit.
Into October, long VRRRs conducted by RBI is going to mature (~1.43 lakh crs outstanding as of 30 Sep 2026) coinciding with the last day of the October MPC meeting. The market is likely to focus on whether the RBI rolls over this liquidity absorption. If participation in the rollover is weak and surplus liquidity rebuilds materially, another round of OMO sales could be considered, keeping RBI liquidity management an important driver of the front end.
USD/INR: Rupee Remains Relatively Stable
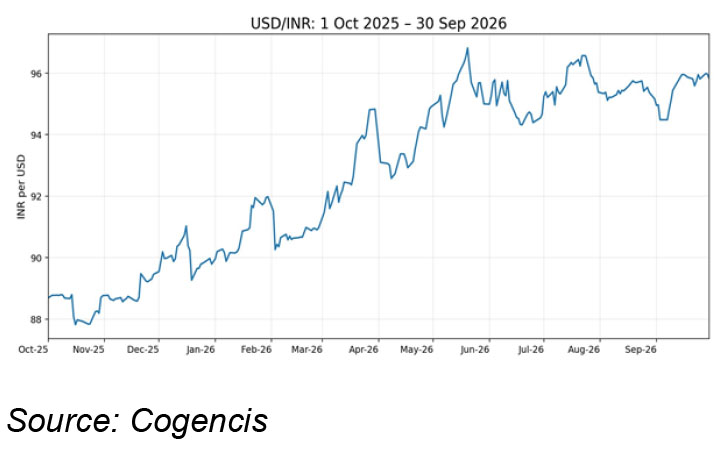
USD/INR remained relatively stable through September despite the rise in global yields and elevated crude prices.
The rupee moved from around 94.95 at the start of the month to a September high of about 95.98 before ending at 95.83. The limited month-end depreciation suggests that the currency absorbed the external rate and oil pressure relatively well, with RBI intervention and earlier foreign-currency inflows providing a buffer. Persistent crude above US$100/bbl, however, remains an important external risk for the currency and domestic inflation.
Brent Crude: Elevated and Volatile
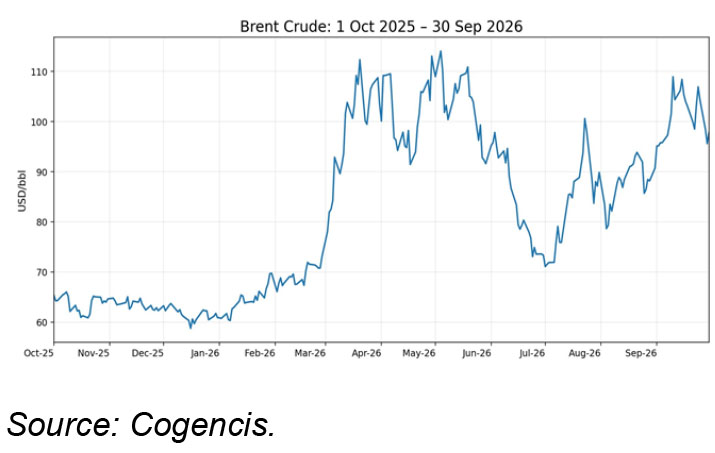
Brent crude remained volatile through September, rising from the mid-$90s/bbl at the start of the month to a high of around $108.75/bbl before ending the month at around $103.46/bbl. The persistence of crude near or above $100/bbl keeps upside risks to domestic inflation elevated and increases the sensitivity of the RBI’s reaction function to energy prices.
G-sec and T-bill Curve: Belly Reprices Sharply
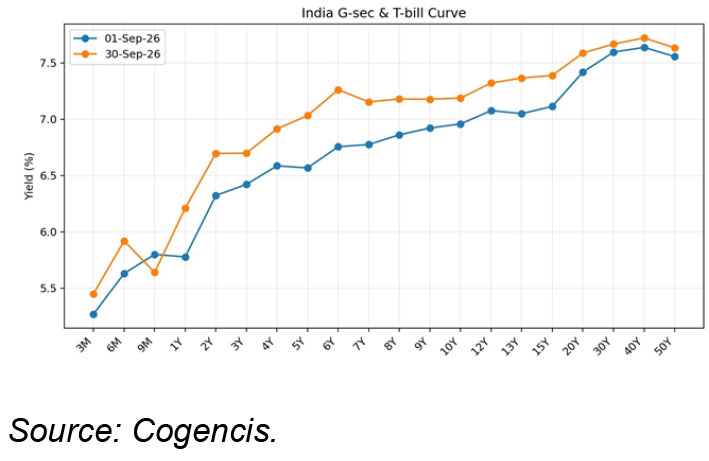
September’s key curve signal was the sharp repricing in the 2–7 year segment, while the long end moved comparatively less. The 5-year yield rose by around 46 bps and the 6-year by around 51 bps, versus a rise of around 23 bps in the 10-year and only 7–8 bps at the 30–50 year end. This relative move points to the market pricing a materially tighter domestic policy path. The belly also faced incremental supply pressure from the RBI’s OMO sales, adding duration supply in intermediate maturities and reinforcing the repricing. With 2HFY27 borrowing also concentrated in the 7–15 year segment, the comparatively contained move at the long end leaves the curve vulnerable to further steepening if term premium continues to rise.
2HFY27 G-sec Borrowing: Supply Shifts Toward the Belly and Long End
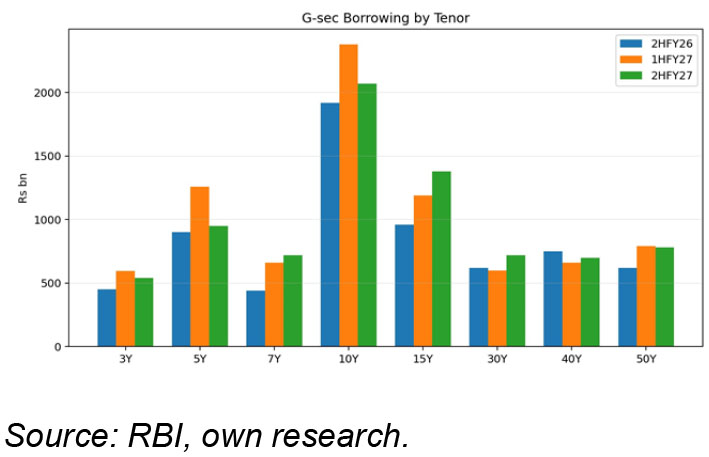
The central government’s 2HFY27 gross borrowing programme is around ₹7.86 tn, taking FY27 gross borrowing to ₹16 tn. The supply mix is lower in the 3–5 year segment at 19% of 2HFY27 issuance versus 22.8% in 1HFY27, while 30–50 year supply rises to 28% from 25.2%. The 7–15 year segment accounts for 53.1% of total 2HFY27 supply. October net G-sec issuance is around ₹1.34 tn, while January is the largest net-issuance month at around ₹1.73 tn. 3QFY27 competitive T-bill net issuance is ₹297 bn, with gross issuance of around ₹2.99 tn.
Certificate of Deposit Curve: Longer Tenors Reprice
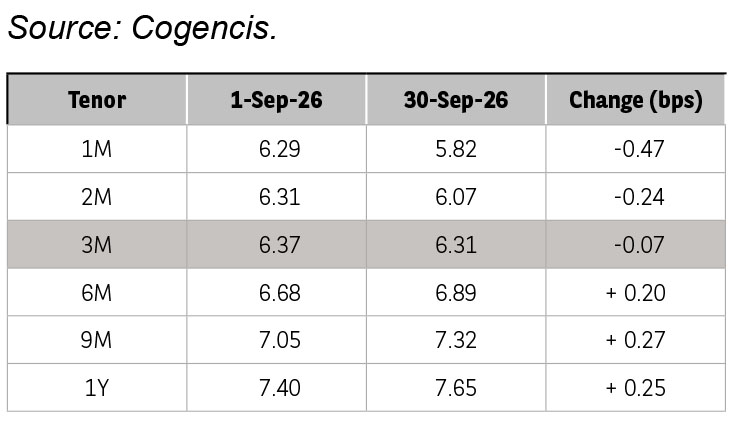
The CD curve also reflected the shift toward a higher-for-longer rate environment. Shorter maturities remained relatively supported by liquidity, while longer maturities were repriced higher. The 1-year CD rate increased by 25 bps during September to 7.65%, leaving the 9–12-month segment at attractive absolute yields, although the higher spread over G-sec yields also reflects the liquidity and credit premium demanded by the market.
Corporate Bonds: 1–3Y Offers Attractive Carry
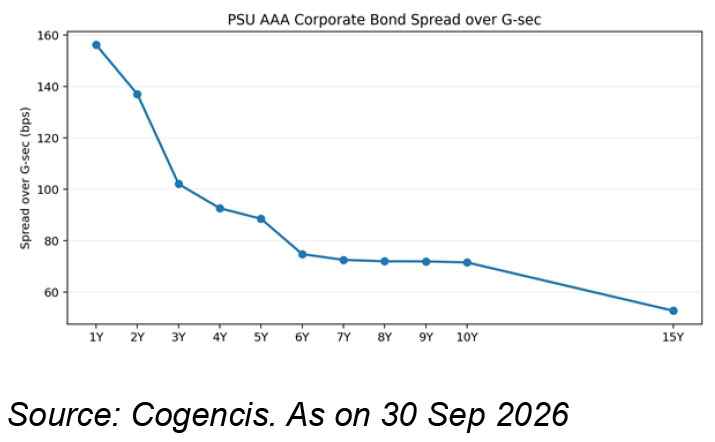
The current PSU AAA corporate bond curve offers attractive carry across the 1–3 year segment. Cogencis data shows PSU AAA yields at 7.66% for 1Y, 7.83% for 2Y and 7.86% for 3Y, with spreads of around 156 bps, 137 bps and 102 bps respectively over comparable G-sec yields. The spread compensation remains meaningful through 3Y, while the relatively shorter maturity limits duration extension. The 1–3 year segment therefore offers an attractive combination of carry and spread cushion, subject to issuer liquidity and credit selection.
Outlook
Our view on Indian fixed income remains constructive on carry, but cautious on outright duration. September’s sharp repricing has improved absolute yields and carry, but the combination of elevated crude, firmer domestic inflation, tighter liquidity, higher global yields and a heavier 2HFY27 borrowing calendar argues against aggressive duration positioning.
We continue to see the 2–5 year G-sec segment as the preferred area for selective duration, but with disciplined entry points rather than broad directional exposure. The 9–12 month CD segment also remains relevant for carry, particularly around the 1-year point at 7.59%, while the higher-forlonger backdrop favours a focus on accrual and liquidity.
At the long end, we remain defensive. The 10-year benchmark was around 7.17% at end-September, while the government’s 2HFY27 programme has meaningful supply concentrated across the 7–15 year segment and a higher share of 30–50 year issuance. Additional supply, elevated global yields and crude-related inflation risk can keep long end yields volatile. We therefore prefer to keep long G-sec exposure tactical and add duration only during supply driven yield dislocations or if inflation and the global rates backdrop improve materially.
The key monitorables for October will be the RBI’s policy decision and liquidity stance, domestic inflation, crude oil prices and US Treasury yields. A sustained moderation in crude and inflation, together with stabilisation in global yields, would improve the case for adding duration. Conversely, persistent crude above $100/bbl, renewed global yield increases or tighter domestic liquidity could lead to another leg higher in domestic yields.
Within corporate bonds, the 1–3 year high-quality PSU AAA segment offers a more defensive carry opportunity. Current spreads are around 156 bps, 137 bps and 102 bps over G-sec at 1Y, 2Y and 3Y respectively, providing a combination of carry and roll-down with limited duration sensitivity. We prefer this segment for accrual, subject to issuer quality and liquidity, while keeping longer-duration credit exposure selective. Overall, the portfolio stance remains carry-led and defensive: preserve liquidity, earn carry and retain the flexibility to add duration when the macro and market backdrop becomes more supportive.
Source- Bloomberg, RBI, MOSPI, TMA, Data latest available as on October 01,2026.
The material contained herein has been obtained from publicly available information, believed to be reliable, but Baroda BNP Paribas Asset Management India Private Limited (BBNPPAMIPL) makes no representation that it is accurate or complete. This information is meant for general reading purposes only and is not meant to serve as a professional guide for the readers. This information is not intended to be an offer to see or a solicitation for the purchase or sale of any financial product or instrument. Past Performance may or may not be sustained in future and is not a guarantee of future returns.
Disclaimers for Market Outlook - Equity: The views and investment tips expressed by experts are their own and are meant for informational purposes only and should not be
construed as investment advice. Investors should check with their financial advisors before taking any investment decisions.
The material contained herein has been obtained from publicly available information, internally developed data and other sources believed to be reliable, but Baroda BNP
Paribas Asset Management India Private Limited (BBNPP), makes no representation that it is accurate or complete. BBNPP has no obligation to tell the recipient when opinions
or information given herein change. It has been prepared without regard to the individual financial circumstances and objectives of persons who receive it. This information is
meant for general reading purposes only and is not meant to serve as a professional guide for the readers. Except for the historical information contained herein, statements in
this publication, which contain words or phrases such as ‘will’, ‘would’, etc., and similar expressions or variations of such expressions may constitute forward-looking statements.
These forward-looking statements involve a number of risks, uncertainties and other factors that could cause actual results to differ materially from those suggested by the
forward-looking statements. BBNPP undertakes no obligation to update forward-looking statements to reflect events or circumstances after the date thereof. Words like believe/
belief are independent perception of the Fund Manager and do not construe as opinion or advice. This information is not intended to be an offer to see or a solicitation for the
purchase or sale of any financial product or instrument. The investment strategy stated above is for illustration purposes only and may or may not be suitable for all investors.