(An open ended balanced advantage fund)
(An open ended balanced advantage fund)

The primary objective of the Scheme is to generate capital appreciation by investing in a portfolio of equity or equity linked securities while the secondary objective is to generate income through investments in debt and money market instruments. It also aims to manage risk through active asset allocation. However, there can be no assurance that the investment objectives of the Scheme will be realized. The Scheme does not guarantee/indicate any returns.
 NAV Details (As on February 27, 2026)
| Regular Plan - IDCW Option | : ₹ 16.5211 |
| Regular Plan - Growth Option | : ₹ 25.1238 |
| Direct Plan - IDCW Option | : ₹ 18.2225 |
| Direct Plan - Growth Option | : ₹ 27.6428 |
 Benchmark Index (Tier 1)
NIFTY 50 Hybrid Composite debt 50:50 Index
 Date of Allotment
November 14, 2018
 Fund Manager
 | Category | Fund Manager | Managing fund since | Experience |
| Equity | Mr. Sanjay Chawla | 14-Nov-18 | 33 years |
| Equity | Mr. Pratish Krishnan | 05-Aug-21 | 23 years |
| Equity | Mr. Neeraj Saxena | 21-Oct-24 | 20 years |
| Fixed Income | Mr. Gurvinder Singh Wasan | 21-Oct-24 | 21 years |
 Load Structure
Exit Load: • If units are redeemed upto 10% of the units, on
or before one year from the date of allotment: Nil • If units
are redeemed over and above the 10% limit, on or before
one year from the date of allotment: 1% of the applicable
Net asset Value (NAV) • If the units are redeemed after one
year from the date of allotment: Nil
For detailed load structure please refer Scheme
Information Document of the scheme.
Minimum Application Amount:
₹ 5,000 and in multiples of ₹ 1 thereafter.
Minimum Additional Application Amount:₹ 1,000 and in multiples of ₹ 1 thereafter
| Monthly AAUM## As on February 27, 2026 | : ₹ 4,765.94 Crores |
| AUM## As on February 27, 2026 | : ₹ 4,766.56 Crores |
## including inter-scheme Investments, if any, by other schemes of BNP Paribas Mutual Fund, as may be applicable
| EQUITY HOLDINGS | % of Net Assets | Derivatives |
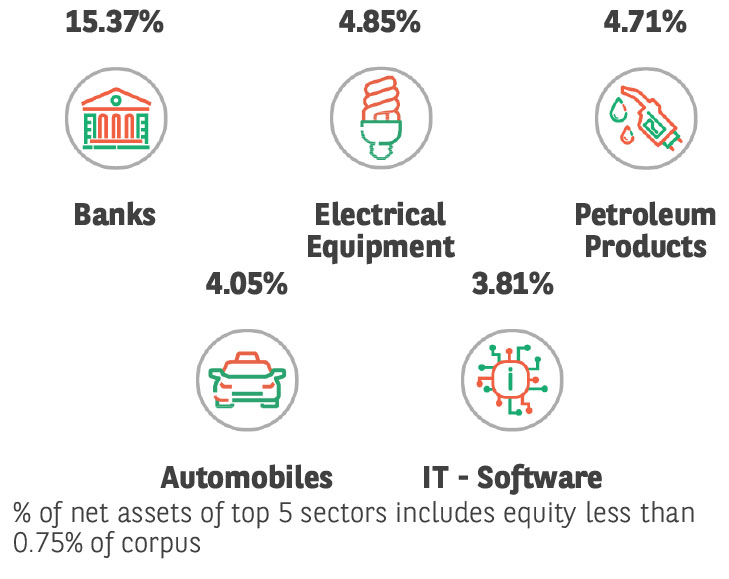
| Banks | 14.91% | |
| ✔ HDFC Bank Limited | 4.84% | |
| ✔ IndusInd Bank Limited | 2.31% | |
| Kotak Mahindra Bank Limited | 1.76% | |
| ICICI Bank Limited | 1.74% | |
| The Federal Bank Limited | 1.70% | |
| Karur Vysya Bank Limited | 1.57% | |
| Canara Bank | 0.99% | |
| Electrical Equipment | 4.85% | |
| ✔ Bharat Heavy Electricals Limited | 1.95% | |
| Hitachi Energy India Limited | 1.61% | |
| GE Vernova T&D India Limited | 1.29% | |
| Petroleum Products | 4.71% | |
| ✔ Reliance Industries Limited | 2.78% | |
| Hindustan Petroleum Corporation Limited | 1.93% | |
| Automobiles | 4.05% | |
| Mahindra & Mahindra Limited | 1.43% | |
| Hyundai Motor India Ltd | 1.36% | |
| Eicher Motors Limited | 1.26% | |
| IT - Software | 3.16% | |
| ✔ Infosys Limited | 2.09% | |
| Tech Mahindra Limited | 1.07% | |
| Capital Markets | 2.91% | |
| Multi Commodity Exchange of India Limited | 1.82% | |
| 360 One WAM Limited | 1.09% | |
| Pharmaceuticals & Biotechnology | 2.75% | |
| Sun Pharmaceutical Industries Limited | 1.68% | |
| Ajanta Pharma Limited | 1.07% | |
| Construction | 2.69% | |
| ✔ Larsen & Toubro Limited | 2.69% | |
| Finance | 2.53% | |
| Shriram Finance Limited | 1.70% | |
| Poonawalla Fincorp Limited | 0.83% | |
| Telecom - Services | 2.46% | |
| ✔ Bharti Airtel Limited | 2.46% | |
| Consumer Durables | 2.34% | |
| Amber Enterprises India Limited | 1.51% | |
| LG Electronics India Ltd | 0.83% | |
| Cement & Cement Products | 2.13% | |
| ✔ UltraTech Cement Limited | 2.13% | |
| Agricultural Food & other Products | 2.11% | |
| Tata Consumer Products Limited | 1.08% | |
| Marico Limited | 1.03% | |
| Aerospace & Defense | 1.77% | |
| Bharat Electronics Limited | 1.77% | |
| Auto Components | 1.76% | |
| Samvardhana Motherson International Limited | 1.76% | |
| Retailing | 1.65% | |
| Eternal Limited | 1.65% | |
| Beverages | 1.61% | |
| Radico Khaitan Limited | 1.61% | |
| Diversified FMCG | 1.47% | |
| Hindustan Unilever Limited | 1.47% | |
| Insurance | 1.44% | |
| ICICI Lombard General Insurance Company Limited | 1.44% | |
| Financial Technology (Fintech) | 1.38% | |
| One 97 Communications Limited | 1.38% | |
| Personal Products | 1.34% | |
| Godrej Consumer Products Limited | 1.34% | |
| Ferrous Metals | 1.33% | |
| JSW Steel Limited | 1.33% | |
| Diversified Metals | 1.06% | |
| Vedanta Limited | 1.06% | |
| IT - Services | 0.76% | |
| Sagility Limited | 0.76% | |
| LESS THAN 0.75% EXPOSURE | 6.13% | |
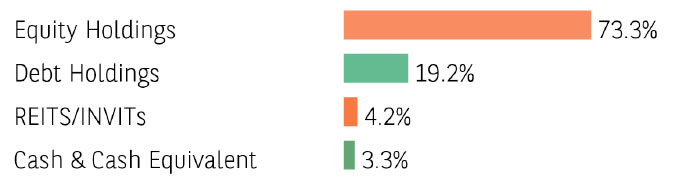
| TOTAL EQUITY HOLDING | 73.3% | |
| InvITs Holdings | % of Net Assets | |
| IndiGrid Infrastructure Trust | 1.18% | |
| National Highways Infra Trust | 1.14% | |
| NXT Infra Trust (NIT) | 1.05% | |
| Capital Infra Trust | 0.34% | |
| Indus Infra Trust | 0.19% | |
| Anzen India Energy Yield Plus Trust | 0.17% | |
| Powergrid Infrastructure Investment Trust | 0.10% | |
| Total InvITs Holdings | 4.17% | |
| FIXED INCOME HOLDINGS | Rating | % of Net Assets |
| GOVERNMENT BOND | 9.50% | |
| ✔ 6.48% GOI (MD 06/10/2035) | Sovereign | 3.44% |
| ✔ 7.18% GOI (MD 14/08/2033) | Sovereign | 2.27% |
| 6.01% GOI (MD 21/07/2030) | Sovereign | 1.23% |
| 6.79% GOI (MD 07/10/2034) | Sovereign | 1.06% |
| 7.09% GOI (MD 05/08/2054) | Sovereign | 0.51% |
| 6.36% GOI (MD 16/02/2031) | Sovereign | 0.42% |
| 7.34% GOI (MD 22/04/2064) | Sovereign | 0.25% |
| 6.68% GOI (MD 07/07/2040) | Sovereign | 0.20% |
| 7.38% GOI (MD 20/06/2027) | Sovereign | 0.11% |
| 6.9% GOI (MD 15/04/2065) | Sovereign | 0.01% |
| CORPORATE BOND | 5.94% | |
| Piramal Finance Limited | ICRA AA | 1.28% |
| National Bank For Agriculture and Rural Development | CRISIL AAA | 0.66% |
| Power Finance Corporation Limited | CRISIL AAA | 0.49% |
| Hindustan Petroleum Corporation Limited | CRISIL AAA | 0.40% |
| NTPC Limited | CRISIL AAA | 0.38% |
| REC Limited | ICRA AAA | 0.33% |
| IndoStar Capital Finance Limited | CARE AA- | 0.32% |
| Larsen & Toubro Limited | CRISIL AAA | 0.32% |
| National Housing Bank | CARE AAA | 0.31% |
| Bajaj Finance Limited | CRISIL AAA | 0.21% |
| Bharti Telecom Limited | CRISIL AAA | 0.21% |
| Bajaj Housing Finance Limited | CRISIL AAA | 0.21% |
| Cholamandalam Investment and Finance Company Ltd | ICRA AA+ | 0.21% |
| Motilal Oswal Home Finance Limited | ICRA AA+ | 0.17% |
| GAIL (India) Limited | CARE AAA | 0.11% |
| Muthoot Finance Limited | CRISIL AA+ | 0.11% |
| Adani Ports and Special Economic Zone Limited | ICRA AAA | 0.11% |
| Tata Projects Limited | FITCH AA | 0.11% |
| CERTIFICATE OF DEPOSIT | 1.89% | |
| Export Import Bank of India | CRISIL A1+ | 0.50% |
| Kotak Mahindra Bank Limited | CRISIL A1+ | 0.50% |
| Small Industries Dev Bank India | CRISIL A1+ | 0.50% |
| National Bank For Agriculture and Rural Development | CRISIL A1+ | 0.39% |
| STATE GOVERNMENT BOND | 1.28% | |
| 7.4% Gujarat SDL (MD 25/02/2036) | Sovereign | 0.52% |
| 7.11% Gujarat SDL (MD 17/03/2031) | Sovereign | 0.42% |
| 7.25% Maharashtra SDL (MD 28/12/2026) | Sovereign | 0.19% |
| 8.08% Karnataka SDL (MD 26/12/2028) | Sovereign | 0.07% |
| 8.08% Gujarat SDL (MD 26/12/2028) | Sovereign | 0.05% |
| 8.08% Tamilnadu SDL (MD 26/12/2028) | Sovereign | 0.03% |
| PTC | 0.63% | |
| Sansar Trust | CRISIL AAA(SO) | 0.51% |
| India Universal Trust | CRISIL AAA(SO) | 0.12% |
| Total Fixed Income Holdings | 19.24% | |
| TREPS, Cash & Other Net Current Assets | 3.29% | |
| GRAND TOTAL | 100.00% |
Investment in Top 10 scrips constitutes 26.96% of the portfolio
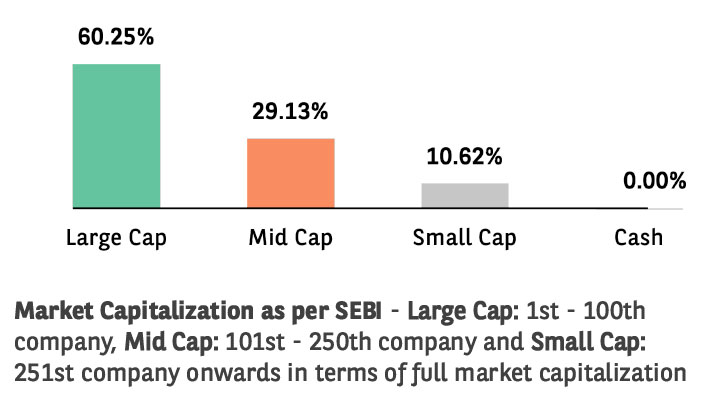
Net equity holdings is 73.3% of the portfolio
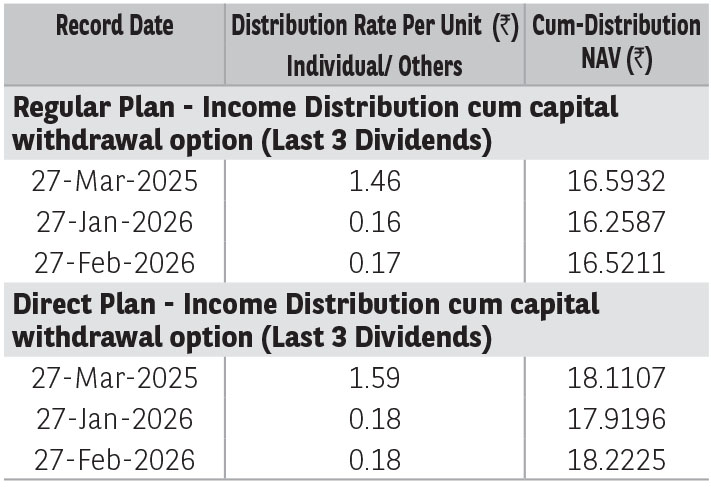
Pursuant to distribution under Income Distribution cum Capital Withdrawal (‘IDCW’) option, NAV of the IDCW option of the scheme(s) would fall to the extent of payout and statutory levy (if applicable). The
amounts under IDCW options can be distributed out of investors capital (Equalization Reserve), which is part of sale price that represents realized gains. Past performance may or may not be sustained in future.
The above stated distribution rate per unit is net distribution rate after deducting applicable taxes. The above distribution rates are on face value of ₹ 10 per unit.
| TER - Regular Plan (%) | 1.88% |
| TER - Direct Plan (%) | 0.75% |
| Equity Portfolio Turnover Ratio# | 0.59 |
| Total Portfolio Turnover Ratio | 1.17 |
| Standard Deviation* | 9.32% |
| Beta* | 1.39 |
| Sharpe Ratio* | 1.04 |
| Sharpe Ratio (annualised), Standard Deviation (annualised) and Beta are based on last 36 monthly data points. | |
The risk free rate of return considered for calculation of Sharpe ratio is 5.17%, as per 1 day MIBOR rate on the last business day of the month.
#Equity portfolio turnover ratio excludes transactions in derivatives. Total Portfolio Turnover ratio is sum of Equity, Debt, and Derivative.
| Average Maturity (years) | 5.67 |
| Modified Duration (years) | 3.71 |
| YTM (%) | 6.77% |
| Macaulay Duration† (years) | 3.85 |
†Concept of Macaulay duration: The Macaulay Duration is a measure of a bond’s sensitivity to interest rate changes. It is expressed in annual terms. It is the weighted average term to maturity of the cash flows from a bond. The weight of each cash flow is determined by dividing the present value of the cash flow by the price. Factors like a bond’s price, maturity, coupon, yield to maturity among others impact the calculation of Macaulay duration. The Macaulay duration can be viewed as the economic balance point of a group of cash flows. Another way to interpret the statistic is that it is the weighted average number of years an investor must maintain a position in the bond until the present value of the bond’s cash flows equals the amount paid for the bond. As it provides a way to estimate the effect of certain market changes on a bond’s price, the investor can choose an investment that will better meet his future cash needs.
➤ Capital appreciation over medium to long term.
➤ Investments in equity and equity linked securities as well as debt and money market instruments while managing risk through active asset allocation.
*Investors should consult their financial advisers if in doubt about whether the product is suitable for them.
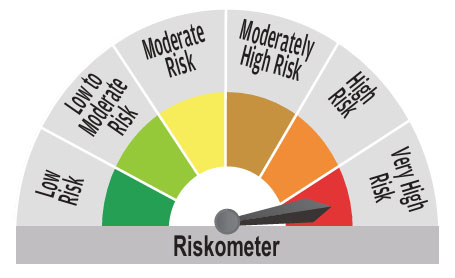
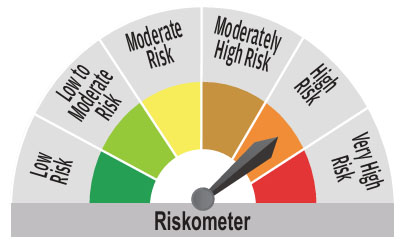
^^Riskometer For Scheme: basis it’s portfolio, ^Riskometer For Benchmark (NIFTY 50 Hybrid Composite debt 50:50 Index): basis it’s constituents; As on February 27, 2026
For complete portfolio, kindly refer the website https://www.barodabnpparibasmf.in/
* refer Glossary page
Mutual Fund investments are subject to market risks, read all scheme related documents carefully.