Financial Services Fund
(An open ended equity scheme investing in the
Banking and Financial Services sector)
Financial Services Fund
(An open ended equity scheme investing in the
Banking and Financial Services sector)

The investment objective is to generate long term capital appreciation for unit holders from a portfolio invested predominantly in equity and equity related securities of companies engaged in the Banking and Financial Services Sector. However, there can be no assurance that the investment objective of the Scheme will be realized The Scheme does not guarantee/ indicate any returns.
 NAV Details (As on May 29, 2026)
| Regular Plan - IDCW Option | : ₹ 19.1770 |
| Regular Plan - Growth Option | : ₹ 46.7637 |
| Direct Plan - IDCW Option | : ₹ 22.2496 |
| Direct Plan - Growth Option | : ₹ 53.0844 |
 Benchmark Index (Tier 1)
Nifty Financial Services TRI
 Date of Allotment
June 22, 2012
 Fund Manager
 | Fund Manager | Managing fund since | Experience |
| Mr. Sanjay Chawla | 29-Nov-25 | 33 years |
| Mr. Yash Mehta | 29-Nov-25 | 1.5 years |
 Load Structure
Exit Load: • If units of the Scheme are redeemed or
switched out within 30 days of the date of allotment 1% of
the applicable Net Asset Value (NAV) • if units of the
Scheme are redeemed are switched out after 30 days of
allotment - Nil
For detailed load structure please refer Scheme
Information Document.
Minimum Amount: Lumpsum investment:
₹ 5,000 and in multiples of ₹ 1
thereafter.
Minimum Additional Application Amount:₹ 1,000 and in
multiples of ₹ 1 thereafter.
| Monthly AAUM## As on May 31, 2026 | : ₹ 394.02 Crores |
| AUM## As on May 31, 2026 | : ₹ 394.93 Crores |
## including inter-scheme Investments, if any, by other schemes of Baroda BNP Paribas Mutual Fund, as may be applicable
| EQUITY HOLDINGS | % of Net Assets | |
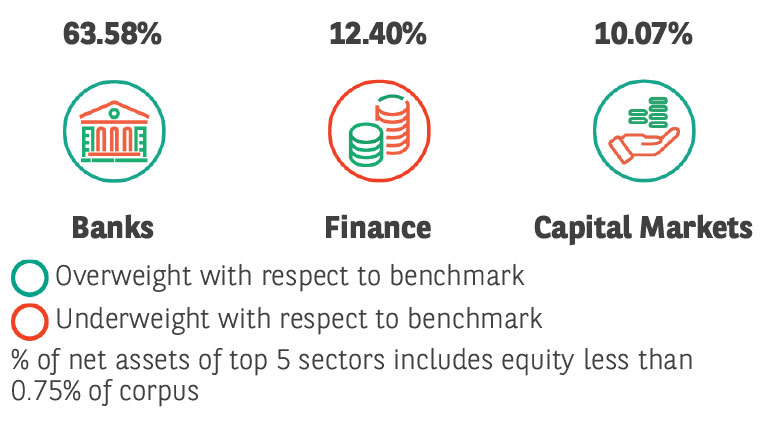
| Banks | 63.58% | |
| ✔ State Bank of India | 9.40% | |
| ✔ Axis Bank Limited | 8.80% | |
| ✔ HDFC Bank Limited | 8.48% | |
| ✔ ICICI Bank Limited | 7.95% | |
| ✔ Kotak Mahindra Bank Limited | 6.32% | |
| ✔ IndusInd Bank Limited | 5.21% | |
| Karur Vysya Bank Limited | 2.74% | |
| The Federal Bank Limited | 2.56% | |
| Ujjivan Small Finance Bank Limited | 2.48% | |
| Union Bank of India | 2.02% | |
| The Jammu & Kashmir Bank Limited | 1.95% | |
| AU Small Finance Bank Limited | 1.75% | |
| Bandhan Bank Limited | 1.58% | |
| City Union Bank Limited | 1.29% | |
| RBL Bank Limited | 1.05% | |
| Finance | 12.40% | |
| ✔ Shriram Finance Limited | 3.48% | |
| ✔ Bajaj Finance Limited | 3.45% | |
| Muthoot Finance Limited | 1.78% | |
| PNB Housing Finance Limited | 1.37% | |
| Cholamandalam Investment and Finance Company Ltd | 1.17% | |
| Aditya Birla Capital Limited | 1.15% | |
| Capital Markets | 10.07% | |
| ✔ Multi Commodity Exchange of India Limited | 3.37% | |
| ICICI Prudential Asset Management Company Limited | 2.24% | |
| BSE Limited | 2.10% | |
| Prudent Corporate Advisory Services Limited | 1.38% | |
| 360 One WAM Limited | 0.98% | |
| Insurance | 4.91% | |
| ✔ SBI Life Insurance Company Limited | 3.01% | |
| Max Financial Services Limited | 1.90% | |
| Financial Technology (Fintech) | 2.15% | |
| One 97 Communications Limited | 2.15% | |
| TOTAL EQUITY HOLDING | 93.11% | |
| Treasury Bill | 1.25% | |
| 364 Days Tbill (MD 17/09/2026) | SOV | 1.25% |
| Total Fixed Income Holdings | 1.25% | |
| TREPS, Cash & Other Net Current Assets | 5.64% | |
| GRAND TOTAL | 100.00% | |
Investment in Top 10 scrips constitutes 59.47% of the portfolio
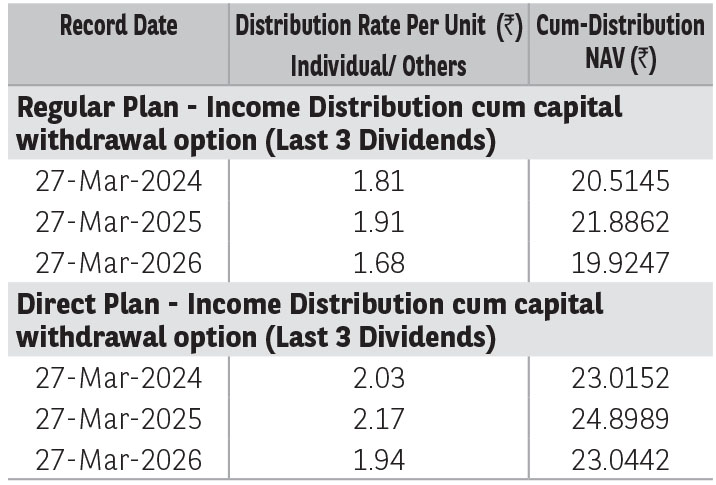
Pursuant to distribution under Income Distribution cum Capital Withdrawal (‘IDCW’) option, NAV of the IDCW option of the scheme(s) would fall to the extent of payout and statutory levy (if applicable). The
amounts under IDCW options can be distributed out of investors capital (Equalization Reserve), which is part of sale price that represents realized gains. Past performance may or may not be sustained in future.
The above stated distribution rate per unit is net distribution rate after deducting applicable taxes. The above distribution rates are on face value of ₹ 10 per unit.
| BER - Regular Plan (%) | 2.10% |
| BER - Direct Plan (%) | 0.68% |
| Portfolio Turnover Ratio | 0.76 |
| Standard Deviation*†† | 15.83% |
| Beta*†† | 0.98 |
| Sharpe Ratio*†† | 0.48 |
| Sharpe Ratio (annualised), Standard Deviation (annualised) and Beta are based on last 36 monthly data points. | |
The risk free rate of return considered for calculation of Sharpe ratio is 5.52%, as per 1 day MIBOR rate on the last business day of the month.
The Total Expense Ratio (TER) is the sum of the Base Expense Ratio (BER), brokerage fees, transaction costs, and statutory levies.
| No of Stocks | 29 |
| Portfolio RoE (%) | 16.14 |
| EPS Growth (%) | 6.68 |
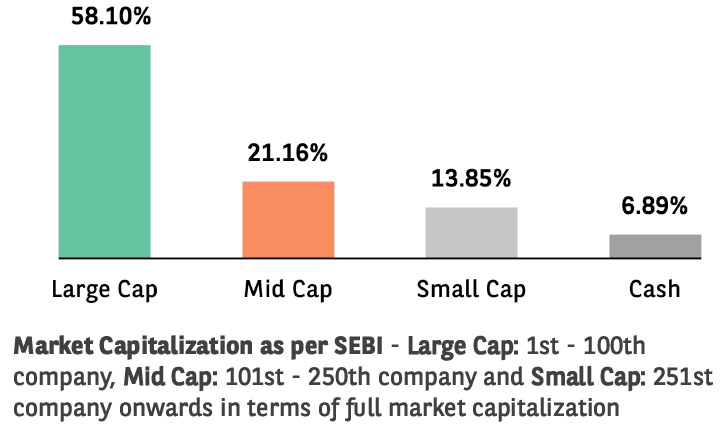
➤ Capital appreciation over long term.
➤ Investment predominantly in equity and equity related securities of companies engaged in the Banking & Financial Services Sector.
*Investors should consult their financial advisers if in doubt about whether the product is suitable for them.
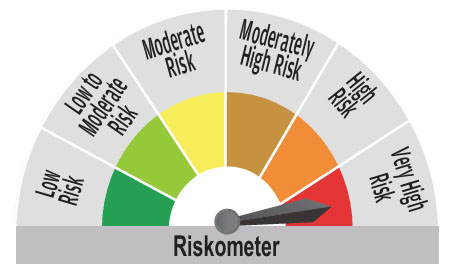
^^Riskometer For Scheme: basis it’s portfolio, ^Riskometer For Benchmark (Nifty Financial Services TRI): basis it’s constituents; As on May 31, 2026
* refer Glossary page
††The scheme is a ‘Transferee Scheme’, and accordingly, the ratios are being provided considering the weighted average NAVs of both the Transferor Scheme and Transferee Scheme.
Mutual Fund investments are subject to market risks, read all scheme related documents carefully.