[An open-ended retirement solution-oriented
scheme having a lock-in of 5 years or till
retirement age (whichever is earlier)]
[An open-ended retirement solution-oriented
scheme having a lock-in of 5 years or till
retirement age (whichever is earlier)]

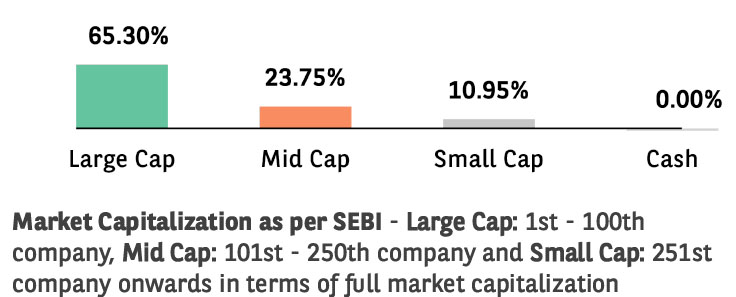
The primary investment objective of the Scheme is to generate income and capital appreciation by investing in a diversifi ed portfolio of equity and equity related instruments and fixed income instruments with a view to provide a retirement solution to investors. However, there can be no assurance that the investment objective of the Scheme will be realized. The Scheme does not guarantee/indicate any returns.
 NAV Details (As on September 30, 2025)
| Regular IDCW | : ₹ 11.0109 |
| Regular Growth | : ₹ 11.0109 |
| Direct IDCW | : ₹ 11.2837 |
| Direct Growth | : ₹ 11.2837 |
 Benchmark Index (Tier 1)
CRISIL Hybrid 35+65 Aggressive Index
 Date of Allotment
May 28, 2024
 Fund Manager
 | Category | Fund Manager | Managing fund since | Experience |
| Equity | Mr. Pratish Krishnan | 28-May-24 | 23 years |
| Equity | Mr. Ankeet Pandya | 01-Jan-25 | 11 years |
| Fixed Income | Mr. Gurvinder Singh Wasan | 21-Oct-24 | 21 years |
 Load Structure
Exit Load: • No Exit Load shall be imposed for switching
between Investment Plan(s) and Plans/Options within the
Investment Plan(s), subject to completion of lock-in period
For detailed load structure please refer Scheme
Information Document.
Minimum Amount: Lumpsum investment:
₹ 1,000 and in multiples of ₹ 1
thereafter.
Minimum Additional Application Amount:₹ 1,000 and in
multiples of ₹ 1 thereafter.
| Monthly AAUM## As on September 30, 2025 | : ₹ 381.62 Crores |
| AUM## As on September 30, 2025 | : ₹ 376.30 Crores |
## including inter-scheme Investments, if any, by other schemes of Baroda BNP Paribas Mutual Fund, as may be applicable
| EQUITY HOLDINGS | % of Net Assets | |
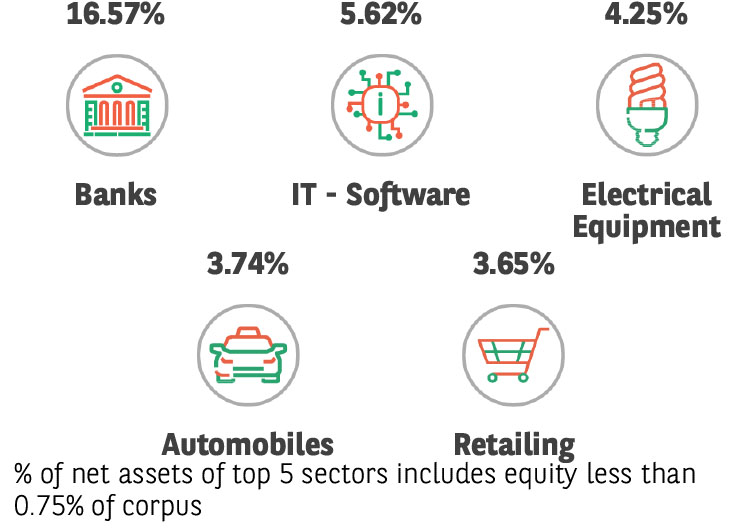
| Banks | 16.57% | |
| ✔HDFC Bank Limited | 5.56% | |
| ✔ICICI Bank Limited | 3.77% | |
| Kotak Mahindra Bank Limited | 1.32% | |
| AU Small Finance Bank Limited | 1.15% | |
| Axis Bank Limited | 1.05% | |
| State Bank of India | 1.04% | |
| Punjab National Bank | 0.94% | |
| Ujjivan Small Finance Bank Limited | 0.89% | |
| City Union Bank Limited | 0.85% | |
| IT - Software | 5.62% | |
| ✔Infosys Limited | 2.17% | |
| Tech Mahindra Limited | 1.60% | |
| Persistent Systems Limited | 0.95% | |
| LTIMindtree Limited | 0.90% | |
| Electrical Equipment | 4.25% | |
| Bharat Heavy Electricals Limited | 1.58% | |
| Hitachi Energy India Limited | 1.52% | |
| GE Vernova T&D India Limited | 1.15% | |
| Automobiles | 3.74% | |
| Mahindra & Mahindra Limited | 1.39% | |
| TVS Motor Company Limited | 1.25% | |
| Hyundai Motor India Ltd | 1.10% | |
| Retailing | 3.65% | |
| ✔Eternal Limited | 2.29% | |
| Vishal Mega Mart Limited | 1.36% | |
| Petroleum Products | 2.97% | |
| ✔Reliance Industries Limited | 2.97% | |
| Pharmaceuticals & Biotechnology | 2.66% | |
| Divi's Laboratories Limited | 1.78% | |
| Cipla Limited | 0.88% | |
| Cement & Cement Products | 2.46% | |
| UltraTech Cement Limited | 1.49% | |
| Ambuja Cements Limited | 0.97% | |
| Healthcare Services | 2.43% | |
| Fortis Healthcare Limited | 1.42% | |
| Max Healthcare Institute Limited | 1.01% | |
| Construction | 2.31% | |
| ✔Larsen & Toubro Limited | 2.31% | |
| Chemicals & Petrochemicals | 2.13% | |
| Navin Fluorine International Limited | 1.20% | |
| Linde India Limited | 0.93% | |
| Telecom - Services | 2.07% | |
| ✔Bharti Airtel Limited | 2.07% | |
| Leisure Services | 1.94% | |
| ✔Travel Food Services Limited | 1.94% | |
| Transport Services | 1.86% | |
| ✔InterGlobe Aviation Limited | 1.86% | |
| Finance | 1.82% | |
| Cholamandalam Investment and Finance Company Ltd | 1.02% | |
| Bajaj Finance Limited | 0.80% | |
| Food Products | 1.81% | |
| Britannia Industries Limited | 1.81% | |
| Financial Technology (Fintech) | 1.77% | |
| One 97 Communications Limited | 0.90% | |
| PB Fintech Limited | 0.87% | |
| Consumer Durables | 1.25% | |
| Titan Company Limited | 1.25% | |
| Beverages | 1.23% | |
| Radico Khaitan Limited | 1.23% | |
| Insurance | 1.22% | |
| Max Financial Services Limited | 1.22% | |
| Power | 1.18% | |
| NTPC Limited | 1.18% | |
| Industrial Products | 1.15% | |
| Cummins India Limited | 1.15% | |
| Capital Markets | 1.15% | |
| Nippon Life India Asset Management Limited | 1.15% | |
| IT - Services | 1.15% | |
| Sagility India Limited | 1.15% | |
| Commercial Services & Supplies | 1.11% | |
| Indiqube Spaces Limited | 1.11% | |
| Non - Ferrous Metals | 0.97% | |
| Hindalco Industries Limited | 0.97% | |
| Transport Infrastructure | 0.78% | |
| Adani Ports and Special Economic Zone Limited | 0.78% | |
| LESS THAN 0.75% EXPOSURE | 1.55% | |
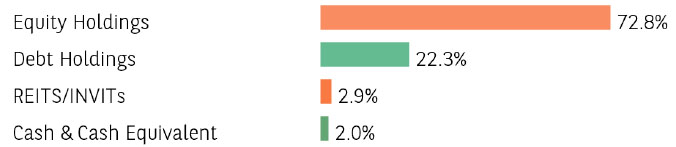
| TOTAL EQUITY HOLDING | 72.8% | |
| REITs/InvITs Holdings | % of Net Assets | |
| Anzen India Energy Yield Plus Trust | 2.90% | |
| Total REITs/InvITs Holdings | 2.90% | |
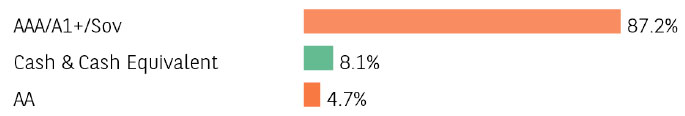
| FIXED INCOME HOLDINGS Rating | % of Net Assets | |
| GOVERNMENT BOND | 19.38% | |
| ✔ 7.34% GOI (MD 22/04/2064) | Sovereign | 16.22% |
| ✔ 6.79% GOI (MD 07/10/2034) | Sovereign | 2.65% |
| 7.09% GOI (MD 05/08/2054) | Sovereign | 0.51% |
| CORPORATE BOND | 3.79% | |
| Jamnagar Utilities & Power Private Limited | CRISIL AAA | 1.34% |
| NTPC Limited | CRISIL AAA | 1.29% |
| Piramal Finance Limited | ICRA AA | 1.16% |
| GOVERNMENT BOND | 18.52% | |
| ✔ 7.34% GOI (MD 22/04/2064) | Sovereign | 16.66% |
| 6.79% GOI (MD 07/10/2034) | Sovereign | 1.34% |
| 7.09% GOI (MD 05/08/2054) | Sovereign | 0.52% |
| CORPORATE BOND | 3.80% | |
| Jamnagar Utilities & Power Private Limited | CRISIL AAA | 1.36% |
| NTPC Limited | CRISIL AAA | 1.31% |
| Piramal Finance Limited | ICRA AA | 1.13% |
| Total Fixed Income Holdings | 22.32% | |
| TREPS, Cash & Other Net Current Assets | 1.97% | |
| GRAND TOTAL | 100.00% |
Investment in Top 10 scrips constitutes 41.60% of the portfolio
The scheme currently does not have Distribution History.
| TER - Regular Plan (%) | 2.41% |
| TER - Direct Plan (%) | 1.16% |
| Portfolio Turnover Ratio | 0.49 |
| Average Maturity (years) | 29.05 |
| Modified Duration (years) | 9.96 |
| YTM (%) | 7.18% |
| Macaulay Duration† (years) | 10.34 |
†Concept of Macaulay duration: The Macaulay Duration is a measure of a bond’s sensitivity to interest rate changes. It is expressed in annual terms. It is the weighted average term to maturity of the cash flows from a bond. The weight of each cash flow is determined by dividing the present value of the cash flow by the price. Factors like a bond’s price, maturity, coupon, yield to maturity among others impact the calculation of Macaulay duration. The Macaulay duration can be viewed as the economic balance point of a group of cash flows. Another way to interpret the statistic is that it is the weighted average number of years an investor must maintain a position in the bond until the present value of the bond’s cash flows equals the amount paid for the bond. As it provides a way to estimate the effect of certain market changes on a bond’s price, the investor can choose an investment that will better meet his future cash needs.
➤ Capital appreciation and Income generation over long term.
➤ Investment in diversified portfolio of equity & equity related securities and fixed Income securities.
*Investors should consult their nancial advisers if in doubt about whether the product is suitable for them.
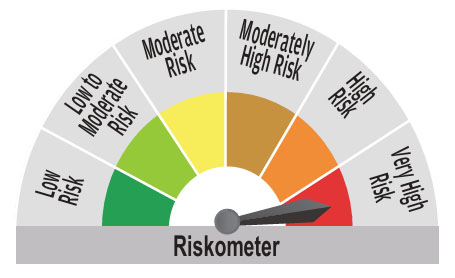
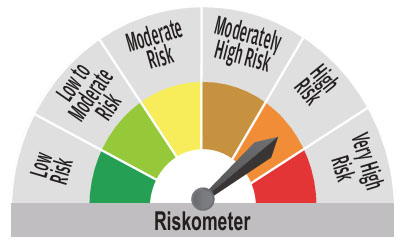
^^Riskometer For Scheme: basis it’s portfolio, ^Riskometer For Benchmark (CRISIL Hybrid 35+65 Aggressive Index): basis it’s constituents; As on September 30, 2025
For complete portfolio, kindly refer the website https://www.barodabnpparibasmf.in/
* refer Glossary page
Mutual Fund investments are subject to market risks, read all scheme related documents carefully.