Nifty Midcap 150 Index Fund
(An open-ended scheme replicating / tracking
the Nifty Midcap 150 Total Returns Index)
Nifty Midcap 150 Index Fund
(An open-ended scheme replicating / tracking
the Nifty Midcap 150 Total Returns Index)

The investment objective of the Scheme is to provide investment returns closely corresponding to the total returns of the securities as represented by the Nifty Midcap 150 Total Returns Index before expenses, subject to tracking errors, fees, and expenses. However, there is no assurance that the objective ofthe Scheme will be achieved.
 NAV Details ( As on April 30, 2026 )
| Regular Plan Growth | : ₹ 10.4879 |
| Direct Plan Growth | : ₹10.5960 |
 Benchmark Index (AMFI Tier 1)
Nifty Midcap 150 Total Returns Index
 Date of Allotment
November 4, 2024
 Fund Manager#
 | Fund Manager | Managing fund since | Experience |
| Mr. Neeraj Saxena | 4-Nov-24 | 20 years |
| Ms. Meenakshi Gururaj | 01-May-26 | 17 years |
#Ms. Meenakshi Gururaj was appointed as Fund Manager w.e.f May 1, 2026.
 Load Structure
Exit Load: • 0.2%- If redeemed on or before 7 days from the
date of allotment. Nil- If redeemed after 7 days from the
date of allotment.
For detailed load structure please refer Scheme Information
Document of the scheme.
Minimum Amount: Lumpsum investment:
₹ 1,000 and in multiples of ₹ 1 thereafter.
Minimum Additional Application Amount:
₹ 1,000 and in multiples of ₹ 1 thereafter.
| Monthly AAUM## As on April 30, 2026 | : ₹ 9.41 Crores |
| AUM## As on April 30, 2026 | : ₹ 9.70 Crores |
## including inter-scheme Investments, if any, by other schemes of BNP Paribas Mutual Fund, as may be applicable
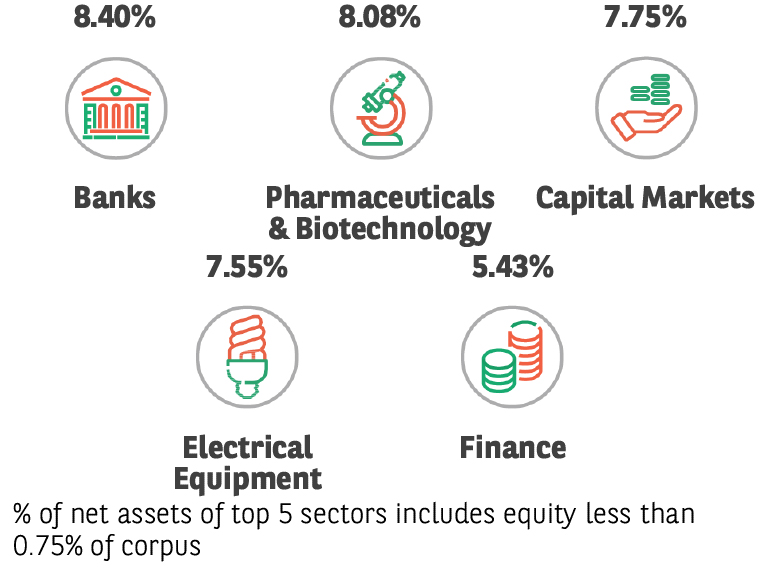
| EQUITY HOLDINGS | % of Net Assets | |
| Banks | 7.57% | |
| ✔ The Federal Bank Limited | 1.82% | |
| ✔ IndusInd Bank Limited | 1.49% | |
| ✔ AU Small Finance Bank Limited | 1.46% | |
| IDFC First Bank Limited | 1.15% | |
| Yes Bank Limited | 0.88% | |
| Indian Bank | 0.77% | |
| Electrical Equipment | 6.32% | |
| ✔ Suzlon Energy Limited | 1.73% | |
| ✔ GE Vernova T&D India Limited | 1.42% | |
| Bharat Heavy Electricals Limited | 1.35% | |
| Hitachi Energy India Limited | 1.07% | |
| Waaree Energies Limited | 0.75% | |
| Capital Markets | 5.67% | |
| ✔ BSE Limited | 3.78% | |
| ✔ Multi Commodity Exchange of India Limited | 1.89% | |
| Pharmaceuticals & Biotechnology | 5.23% | |
| ✔ Lupin Limited | 1.42% | |
| Laurus Labs Limited | 1.07% | |
| Aurobindo Pharma Limited | 1.01% | |
| Glenmark Pharmaceuticals Limited | 0.92% | |
| Alkem Laboratories Limited | 0.81% | |
| IT - Software | 3.12% | |
| Persistent Systems Limited | 1.33% | |
| Coforge Limited | 1.02% | |
| Mphasis Limited | 0.77% | |
| Retailing | 2.85% | |
| Swiggy Limited | 0.96% | |
| Info Edge (India) Limited | 0.96% | |
| FSN E-Commerce Ventures Limited | 0.93% | |
| Consumer Durables | 2.83% | |
| Dixon Technologies (India) Limited | 1.17% | |
| Voltas Limited | 0.85% | |
| Havells India Limited | 0.81% | |
| Industrial Products | 2.76% | |
| Polycab India Limited | 1.10% | |
| APL Apollo Tubes Limited | 0.89% | |
| KEI Industries Limited | 0.77% | |
| Financial Technology (Fintech) | 2.63% | |
| ✔ PB Fintech Limited | 1.43% | |
| One 97 Communications Limited | 1.20% | |
| Insurance | 2.16% | |
| ICICI Lombard General Insurance Company Limited | 1.09% | |
| Max Financial Services Limited | 1.07% | |
| Auto Components | 2.08% | |
| Bharat Forge Limited | 1.27% | |
| Tube Investments of India Limited | 0.81% | |
| Automobiles | 1.68% | |
| ✔ Hero MotoCorp Limited | 1.68% | |
| Power | 1.66% | |
| Torrent Power Limited | 0.86% | |
| JSW Energy Limited | 0.80% | |
| Telecom - Services | 1.35% | |
| Indus Towers Limited | 1.35% | |
| Healthcare Services | 1.24% | |
| Fortis Healthcare Limited | 1.24% | |
| Agricultural, Commercial & Construction Vehicles | 1.20% | |
| Ashok Leyland Limited | 1.20% | |
| Agricultural Food & other Products | 1.04% | |
| Marico Limited | 1.04% | |
| Chemicals & Petrochemicals | 0.92% | |
| SRF Limited | 0.92% | |
| Fertilizers & Agrochemicals | 0.92% | |
| UPL Limited | 0.92% | |
| Petroleum Products | 0.92% | |
| Hindustan Petroleum Corporation Limited | 0.92% | |
| Non - Ferrous Metals | 0.92% | |
| National Aluminium Company Limited | 0.92% | |
| Transport Infrastructure | 0.89% | |
| GMR Airports Limited | 0.89% | |
| Realty | 0.82% | |
| The Phoenix Mills Limited | 0.82% | |
| Finance | 0.79% | |
| Sundaram Finance Limited | 0.79% | |
| Minerals & Mining | 0.79% | |
| NMDC Limited | 0.79% | |
| LESS THAN 0.75% EXPOSURE | 41.41% | |
| TOTAL EQUITY HOLDING | 99.77% | |
| FIXED INCOME HOLDINGS | Rating | % of Net Assets |
| TREPS, Cash & Other Net Current Assets | 0.23% | |
| GRAND TOTAL | 100.00% | |
Investment in Top 10 scrips constitutes 18.12% of the portfolio
| Management Group | % of AUM |
| Public Sector Unit | 4.59 |
| BSE Group | 3.78 |
| HINDUJA GROUP | 2.69 |
| ICICI GROUP | 1.89 |
| MCX Group | 1.89 |
| Federal Bank Group | 1.82 |
| Suzlon Group | 1.73 |
| Grand Total | 18.39 |
| 1 Year | Since Inception | |
| Regular Plan | -1.44% | -1.29% |
| Direct Plan | -0.68% | -0.57% |
The scheme currently does not have Distribution History.
| BER - Regular Plan (%) | 0.90% |
| BER - Direct Plan (%) | 0.33% |
| Portfolio Turnover Ratio | 0.81 |
| Tracking Error - | |
| Regular | 0.12 |
| Direct | 0.11 |
The Total Expense Ratio (TER) is the sum of the Base
Expense Ratio (BER), brokerage fees, transaction costs, and
statutory levies.
➤ Long term capital growth
➤ Investments in equity and equity related securities replicating the composition of the Nifty Midcap 150 Index with the aim to achieve returns of the stated index, subject to tracking error
*Investors should consult their financial advisers if in doubt about whether the product is suitable for them.
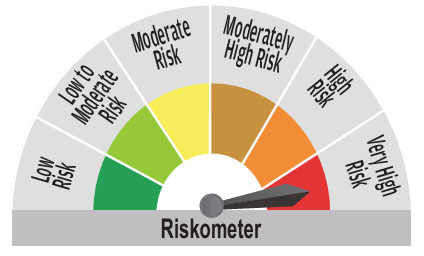
principal will be at Very High risk
^^Riskometer For Scheme: basis it’s portfolio, ^Riskometer For Benchmark (Nifty 200 Momentum 30 TRI): basis it’s constituents; As on April 30, 2026
NSE Indices Limited - The Products offered by “Baroda BNP Paribas Mutual Fund/ Baroda BNP Paribas Asset Management India Pvt. Ltd” or its affiliates is not sponsored, endorsed, sold or promoted by NSE Indices Limited (NSE Indices) and its affiliates. NSE Indices and its affiliates do not make any representation or warranty, express or implied (including warranties of merchantability or fitness for particular purpose or use) to the owners of these Products or any member of the public regarding the advisability of investing in securities generally or in the Products linked to their underlying indices to track general stock market performance in India. Please read the full Disclaimers in relation to the underlying indices in the respective Scheme Information Document.
* refer Glossary page
Mutual Fund investments are subject to market risks, read all scheme related documents carefully.