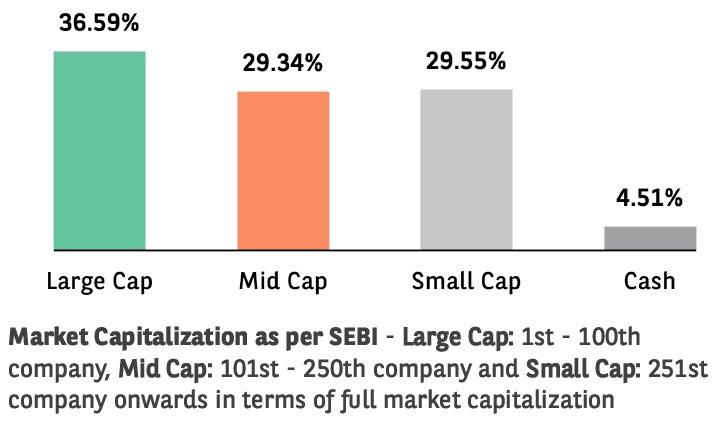
(An open ended equity scheme investing across
large cap, mid-cap and small cap stocks)
(An open ended equity scheme investing across
large cap, mid-cap and small cap stocks)

The investment objective is to generate long term capital appreciation from an actively managed portfolio of equity & equity related instruments. The Scheme does not guarantee/ indicate any returns. However, there is no assurance that the investment objective of the Scheme will be achieved.
 NAV Details (As on April 30, 2026)
| Regular Plan - IDCW Option | : ₹ 50.3103 |
| Regular Plan - Growth Option | : ₹ 281.8383 |
| Direct Plan - IDCW Option | : ₹ 53.8853 |
| Direct Plan - Growth Option | : ₹ 318.9358 |
 Benchmark Index (AMFI Tier 1)
Nifty 500 Multicap 50:25:25 TRI
 Date of Allotment
September 12, 2003
 Fund Manager
 | Fund Manager | Managing fund since | Experience |
| Mr.Sanjay Chawla | 01-Nov-15 | 33 years |
| Mr. Kirtan Mehta | 29-Nov-25 | 26 years |
 Load Structure
Exit Load: • 1% if redeemed on or before 12 months from
the date of allotment of units. NIL if redeemed after 12
months from the date of allotment of units
For detailed load structure please refer Scheme
Information Document.
Minimum Amount: Lumpsum investment:
₹ 5,000 and in multiples of ₹ 1 thereafter.
Minimum Additional Application Amount:₹ 1,000 and in multiples of ₹ 1 thereafter.
| Monthly AAUM## As on April 30, 2026 | : ₹ 3,106.24 Crores |
| AUM## As on April 30, 2026 | : ₹ 3,218.97 Crores |
## including inter-scheme Investments, if any, by other schemes of Baroda BNP Paribas Mutual Fund, as may be applicable
| EQUITY HOLDINGS | % of Net Assets | |
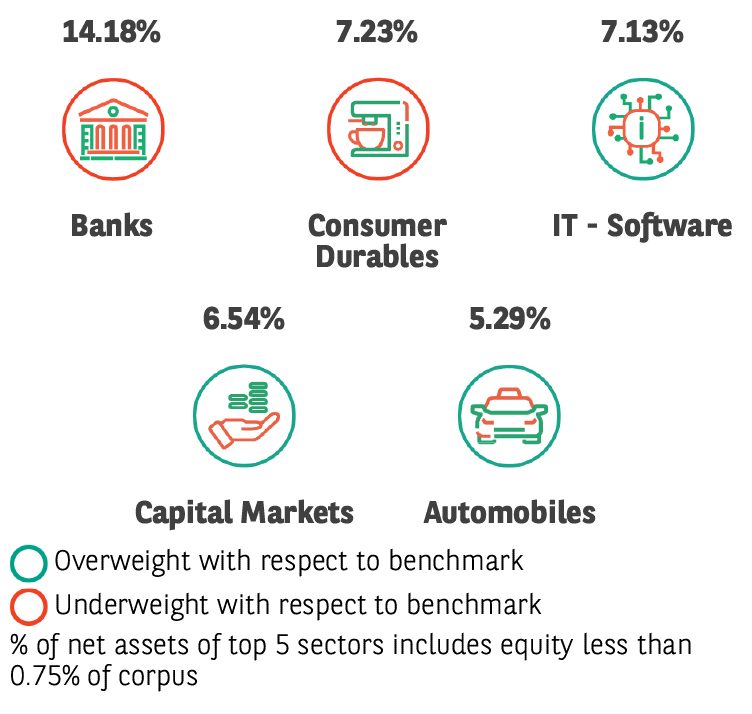
| Banks | 13.46% | |
| ✔IndusInd Bank Limited | 2.92% | |
| ✔Karur Vysya Bank Limited | 2.28% | |
| HDFC Bank Limited | 2.16% | |
| Axis Bank Limited | 1.87% | |
| Canara Bank | 1.67% | |
| ICICI Bank Limited | 1.57% | |
| RBL Bank Limited | 0.99% | |
| Consumer Durables | 7.23% | |
| ✔Titan Company Limited | 2.18% | |
| Amber Enterprises India Limited | 2.12% | |
| Crompton Greaves Consumer Electricals Limited | 1.69% | |
| Blue Star Limited | 1.24% | |
| IT - Software | 7.13% | |
| ✔Persistent Systems Limited | 2.39% | |
| Tech Mahindra Limited | 1.83% | |
| Infosys Limited | 1.47% | |
| Fractal Analytics Ltd | 1.44% | |
| Capital Markets | 5.88% | |
| BSE Limited | 1.70% | |
| Multi Commodity Exchange of India Limited | 1.66% | |
| Nippon Life India Asset Management Limited | 1.57% | |
| Aditya Birla Sun Life AMC Limited | 0.95% | |
| Automobiles | 5.26% | |
| TVS Motor Company Limited | 2.17% | |
| Mahindra & Mahindra Limited | 1.64% | |
| Maruti Suzuki India Limited | 1.45% | |
| Chemicals & Petrochemicals | 5.19% | |
| ✔Navin Fluorine International Limited | 2.75% | |
| Linde India Limited | 1.48% | |
| Solar Industries India Limited | 0.96% | |
| Pharmaceuticals & Biotechnology | 5.19% | |
| JB Chemicals & Pharmaceuticals Limited | 2.06% | |
| Acutaas Chemicals Limited | 1.73% | |
| Sun Pharmaceutical Industries Limited | 1.40% | |
| Electrical Equipment | 5.04% | |
| ✔Bharat Heavy Electricals Limited | 2.96% | |
| Hitachi Energy India Limited | 2.08% | |
| Petroleum Products | 3.25% | |
| ✔Reliance Industries Limited | 2.44% | |
| Hindustan Petroleum Corporation Limited | 0.81% | |
| Industrial Products | 3.20% | |
| ✔Cummins India Limited | 2.29% | |
| Timken India Limited | 0.91% | |
| Telecom - Services | 3.08% | |
| ✔Bharti Airtel Limited | 3.08% | |
| Beverages | 2.32% | |
| ✔Radico Khaitan Limited | 2.32% | |
| Finance | 2.28% | |
| Bajaj Finance Limited | 1.31% | |
| Aditya Birla Capital Limited | 0.97% | |
| IT - Services | 2.04% | |
| Sagility Limited | 2.04% | |
| Transport Services | 2.03% | |
| Delhivery Limited | 2.03% | |
| Insurance | 1.98% | |
| SBI Life Insurance Company Limited | 1.98% | |
| Food Products | 1.97% | |
| Britannia Industries Limited | 1.97% | |
| Minerals & Mining | 1.97% | |
| NMDC Limited | 1.97% | |
| Healthcare Services | 1.87% | |
| Dr. Lal Path Labs Limited | 1.87% | |
| Agricultural, Commercial & Construction Vehicles | 1.68% | |
| BEML Limited | 1.68% | |
| Non - Ferrous Metals | 1.55% | |
| National Aluminium Company Limited | 1.55% | |
| Construction | 1.50% | |
| Larsen & Toubro Limited | 1.50% | |
| Financial Technology (Fintech) | 1.43% | |
| One 97 Communications Limited | 1.43% | |
| Power | 1.34% | |
| NHPC Limited | 1.34% | |
| Cement & Cement Products | 1.23% | |
| The India Cements Limited | 1.23% | |
| Leisure Services | 0.95% | |
| Travel Food Services Limited | 0.95% | |
| Retailing | 0.92% | |
| Eternal Limited | 0.92% | |
| Commercial Services & Supplies | 0.85% | |
| Indiqube Spaces Limited | 0.85% | |
| LESS THAN 0.75% EXPOSURE | 3.64% | |
| TOTAL EQUITY HOLDING | 95.46% | |
| PREFSHARE TOTAL | 0.03% | |
| 6% TVS Motor Co Non Conv Rede Pref Shares 01SEP26 | 0.03% | |
| FIXED INCOME HOLDINGS | Rating | % of Net Assets |
| Treasury Bill | 1.07% | |
| 364 Days Tbill (MD 17/09/2026) | SOV | 1.07% |
| Total Fixed Income Holdings | 1.07% | |
| TREPS, Cash & Other Net Current Assets | 3.44% | |
| GRAND TOTAL | 100.00% | |
Investment in Top 10 scrips constitutes 25.61% of the portfolio
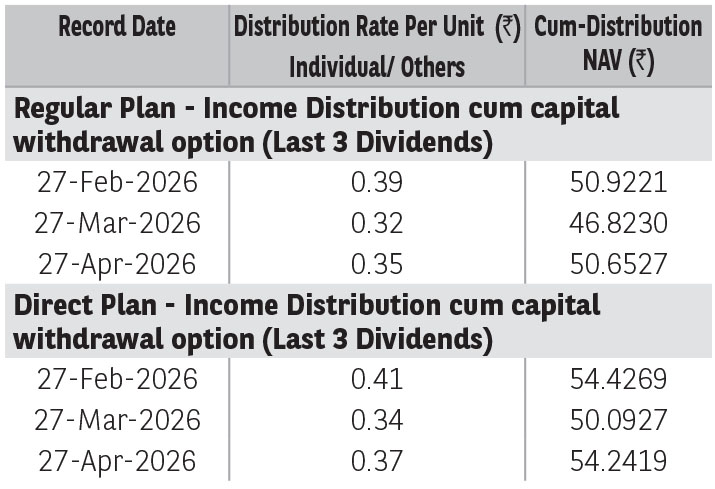
Pursuant to distribution under Income Distribution cum Capital Withdrawal (‘IDCW’) option, NAV of the IDCW option of the scheme(s) would fall to the extent of payout and statutory levy (if applicable). The
amounts under IDCW options can be distributed out of investors capital (Equalization Reserve), which is part of sale price that represents realized gains. Past performance may or may not be sustained in future.
The above stated distribution rate per unit is net distribution rate after deducting applicable taxes. The above distribution rates are on face value of ₹ 10 per unit.
| BER - Regular Plan (%) | 1.66% |
| BER - Direct Plan (%) | 0.76% |
| Portfolio Turnover Ratio | 1.05 |
| Standard Deviation*†† | 15.93% |
| Beta*†† | 0.91 |
| Sharpe Ratio*†† | 0.76 |
| Sharpe Ratio (annualised), Standard Deviation (annualised) and Beta are based on last 36 monthly data points. | |
| †† The scheme is a ‘Transferee Scheme’, and accordingly, the ratios are being provided considering the weighted average NAVs of both the Transferor Scheme and Transferee Scheme. | |
The Total Expense Ratio (TER) is the sum of the Base
Expense Ratio (BER), brokerage fees, transaction costs, and
statutory levies.
The risk free rate of return considered for calculation of Sharpe ratio is 5.34%, as per 1 day MIBOR rate on the last business day of the month.
| No of Stocks | 60 |
| Portfolio RoE (%) | 15.96 |
| EPS Growth (%) | 35.60 |
➤ Capital appreciation over long term.
➤ Investments predominantly in equity and equity related instruments.
*Investors should consult their financial advisers if in doubt about whether the product is suitable for them.
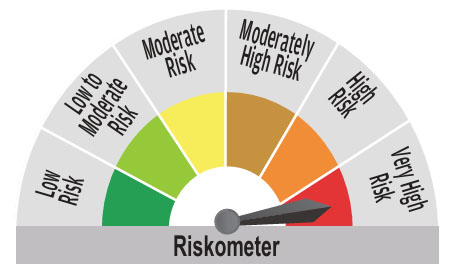
^^Riskometer For Scheme: basis it’s portfolio, ^Riskometer For Benchmark (Nifty 500 Multicap 50:25:25 TRI): basis it’s constituents; As on April 30, 2026
For complete portfolio, kindly refer the website https://www.barodabnpparibasmf.in/
* refer Glossary page
Mutual Fund investments are subject to market risks, read all scheme related documents carefully.