(An open-ended equity scheme predominantly
investing in dividend yielding stocks.)
(An open-ended equity scheme predominantly
investing in dividend yielding stocks.)

The investment objective is to provide medium to long term appreciation by predominantly investing in a well-diversified portfolio of equity and equity related instruments of dividend yielding companies. There is no assurance that the investment objective of the Scheme will be achieved.
 NAV Details (As on January 30, 2026)
| Regular IDCW | : ₹ 9.6461 |
| Regular Growth | : ₹ 9.6461 |
| Direct IDCW | : ₹ 9.8662 |
| Direct Growth | : ₹ 9.8662 |
 Benchmark Index (Tier 1)
Nifty 500 TRI
 Date of Allotment
September 11, 2024
 Fund Manager
 | Fund Manager | Managing fund since | Experience |
| Mr. Jitendra Sriram** | 29-Nov-25 | 27 years |
| Mr. Himanshu Singh | 21-Oct-24 | 10 years |
 Load Structure
Exit Load: • If units of the Scheme are redeemed or
switched out up to 10% of the units within 1 year from the
date of allotment - Nil. • If units of the scheme are
redeemed or switched out in excess of the limit within 1
year from the date of allotment - 1% of the applicable NAV.
• If units of scheme are redeemed or switched out after 1
year from the date of allotment - Nil
For detailed load structure please refer Scheme
Information Document.
Minimum Amount: Lumpsum investment:
₹ 1,000 and in multiples of ₹ 1
thereafter.
Minimum Additional Application Amount:₹ 1,000 and in
multiples of ₹ 1 thereafter.
| Monthly AAUM## As on January 30, 2026 | : ₹ 742.20 Crores |
| AUM## As on January 30, 2026 | : ₹ 718.10 Crores |
## including inter-scheme Investments, if any, by other schemes of Baroda BNP Paribas Mutual Fund, as may be applicable
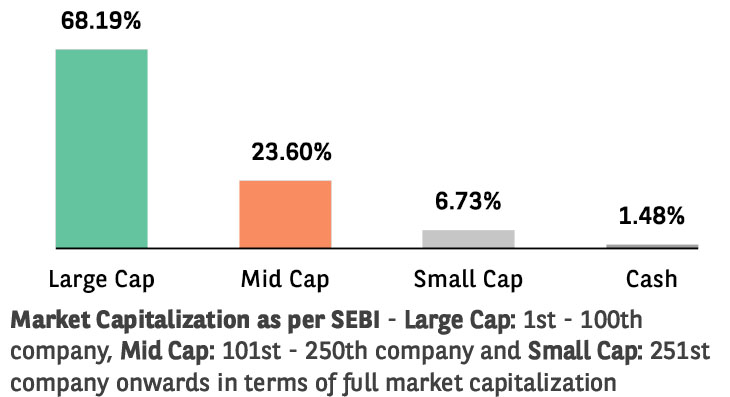
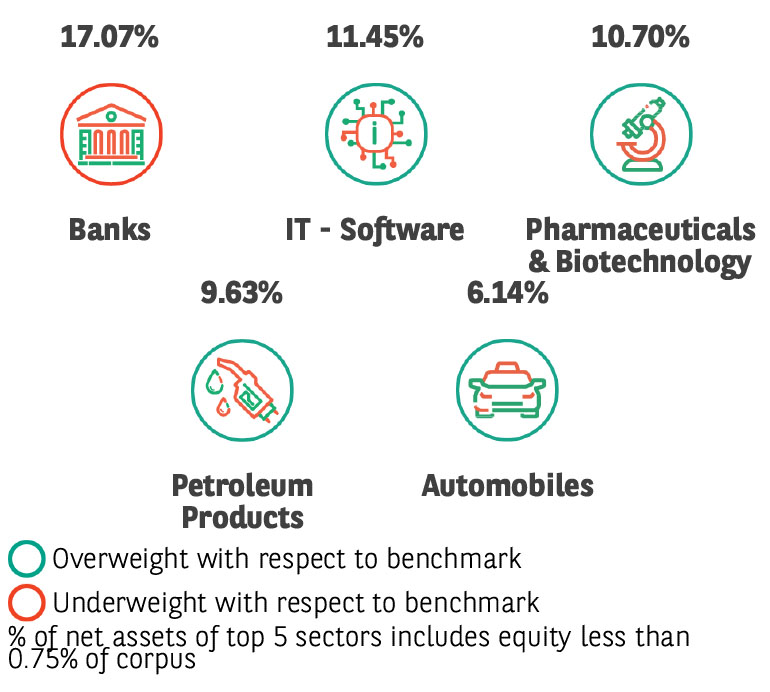
| EQUITY HOLDINGS | % of Net Assets | |
| Banks | 17.07% | |
| ✔HDFC Bank Limited | 6.41% | |
| ✔ICICI Bank Limited | 4.42% | |
| ✔Kotak Mahindra Bank Limited | 2.71% | |
| Canara Bank | 2.22% | |
| IDFC First Bank Limited | 1.31% | |
| IT - Software | 11.45% | |
| ✔Infosys Limited | 3.70% | |
| ✔Tata Consultancy Services Limited | 2.35% | |
| Tech Mahindra Limited | 1.94% | |
| HCL Technologies Limited | 1.28% | |
| Wipro Limited | 1.10% | |
| Oracle Financial Services Software Limited | 1.08% | |
| Pharmaceuticals & Biotechnology | 10.70% | |
| ✔JB Chemicals & Pharmaceuticals Limited | 2.86% | |
| GlaxoSmithKline Pharmaceuticals Limited | 2.11% | |
| Divi's Laboratories Limited | 2.05% | |
| Sun Pharmaceutical Industries Limited | 2.00% | |
| Dr. Reddy's Laboratories Limited | 1.68% | |
| Petroleum Products | 9.63% | |
| ✔Reliance Industries Limited | 6.65% | |
| Hindustan Petroleum Corporation Limited | 1.61% | |
| Bharat Petroleum Corporation Limited | 1.37% | |
| Automobiles | 6.14% | |
| Hero MotoCorp Limited | 2.29% | |
| Hyundai Motor India Ltd | 2.06% | |
| Eicher Motors Limited | 1.79% | |
| Construction | 4.44% | |
| ✔Larsen & Toubro Limited | 4.44% | |
| Auto Components | 4.14% | |
| Bharat Forge Limited | 1.63% | |
| Tenneco Clean Air India Limited | 1.37% | |
| Bosch Limited | 1.14% | |
| Food Products | 3.33% | |
| Nestle India Limited | 1.86% | |
| Britannia Industries Limited | 1.47% | |
| Oil | 3.27% | |
| Oil India Limited | 1.92% | |
| Oil & Natural Gas Corporation Limited | 1.35% | |
| Diversified Metals | 2.99% | |
| ✔Vedanta Limited | 2.99% | |
| Finance | 2.87% | |
| Bajaj Finance Limited | 1.75% | |
| Cholamandalam Investment and Finance Company Ltd | 1.12% | |
| Capital Markets | 2.84% | |
| ICRA Limited | 1.42% | |
| 360 One WAM Limited | 1.42% | |
| Electrical Equipment | 2.83% | |
| ✔GE Vernova T&D India Limited | 2.83% | |
| Power | 2.66% | |
| NHPC Limited | 1.57% | |
| SJVN Limited | 1.09% | |
| Cement & Cement Products | 2.21% | |
| UltraTech Cement Limited | 2.21% | |
| Non - Ferrous Metals | 1.93% | |
| National Aluminium Company Limited | 1.93% | |
| Healthcare Services | 1.56% | |
| Max Healthcare Institute Limited | 1.56% | |
| Beverages | 1.56% | |
| Radico Khaitan Limited | 1.56% | |
| Agricultural, Commercial & Construction Vehicles | 1.44% | |
| Escorts Kubota Limited | 1.44% | |
| Diversified FMCG | 1.21% | |
| ITC Limited | 1.21% | |
| Consumer Durables | 1.10% | |
| LG Electronics India Ltd | 1.10% | |
| Insurance | 0.91% | |
| ICICI Lombard General Insurance Company Limited | 0.91% | |
| Industrial Products | 0.82% | |
| SKF India (Industrial) Ltd | 0.82% | |
| LESS THAN 0.75% EXPOSURE | 0.26% | |
| FUTURES LONG POSITION | 1.19% | |
| Multi Commodity Exchange of India Limited | 1.19% | |
| TOTAL EQUITY HOLDING | 98.55% | |
| FIXED INCOME HOLDINGS | Rating | % of Net Assets |
| Treasury Bill | 1.37% | |
| 364 Days Tbill (MD 11/06/2026) | SOV | 1.37% |
| Total Fixed Income Holdings | 1.37% | |
| TREPS, Cash & Other Net Current Assets | 0.08% | |
| GRAND TOTAL | 100.00% | |
Investment in Top 10 scrips constitutes 39.36% of the portfolio
| TER - Regular Plan (%) | 2.34% |
| TER - Direct Plan (%) | 1.13% |
| Portfolio Turnover Ratio | 0.65 |
| No of Stocks | 52 |
| Portfolio RoE (%) | 20.41 |
| EPS Growth (%) | 18.12 |
➤ Long term capital appreciation
➤ Investment predominantly in equity and equity related instruments of dividend yielding companies.
*Investors should consult their financial advisers if in doubt about whether the product is suitable for them.
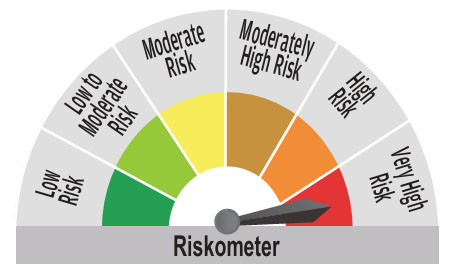
^^Riskometer For Scheme: basis it’s portfolio, ^Riskometer For Benchmark (Nifty 500 TRI): basis it’s constituents; As on January 30, 2026
For complete portfolio, kindly refer the website https://www.barodabnpparibasmf.in/
* refer Glossary page
Mutual Fund investments are subject to market risks, read all scheme related documents carefully.