(An Open ended dynamic equity scheme investing across
large cap, mid cap, small cap companies)
(An Open ended dynamic equity scheme investing across
large cap, mid cap, small cap companies)

The Scheme seeks to generate long term capital appreciation by investing in a dynamic mix of equity and equity related instruments across market capitalizations. However, there is no assurance that the investment objective of the Scheme will be achieved. The Scheme does not guarantee/indicate any returns.
 NAV Details (As on January 30, 2026)
| Regular Plan-IDCW | : ₹ 14.0234 |
| Regular Plan-Growth Option | : ₹ 15.3706 |
| Direct Plan-IDCW | : ₹ 14.7150 |
| Direct Plan-Growth Option | : ₹ 16.1303 |
 Benchmark Index (AMFI Tier 1)
Nifty 500 TRI
 Date of Allotment
August 17, 2022
 Fund Manager
 | Fund Manager | Managing fund since | Experience |
| Mr. Sanjay Chawla | 17-Aug-22 | 33 years |
| Mr. Kirtan Mehta | 01-Jan-25 | 26 years |
 Load Structure
Exit Load: • If units of the Scheme are redeemed or
switched out up to 10% of the units (the limit) within 12
months from the date of allotment - Nil. • If units of the
scheme are redeemed or switched out in excess of the limit
within 12 months from the date of allotment - 1% of the
applicable NAV. • If units of scheme are redeemed or
switched out after 12 months from the date of allotment -
Nil.
For detailed load structure please refer Scheme
Information Document.
Minimum Amount: Lumpsum investment:
₹ 5,000 and in multiples of ₹ 1
thereafter.
Minimum Additional Application Amount:₹ 1,000 and in
multiples of ₹ 1 thereafter.
| Monthly AAUM## As on January 30, 2026 | : ₹ 1,237.27 Crores |
| AUM## As on January 30, 2026 | : ₹ 1,221.70 Crores |
## including inter-scheme Investments, if any, by other schemes of Baroda BNP Paribas Mutual Fund, as may be applicable
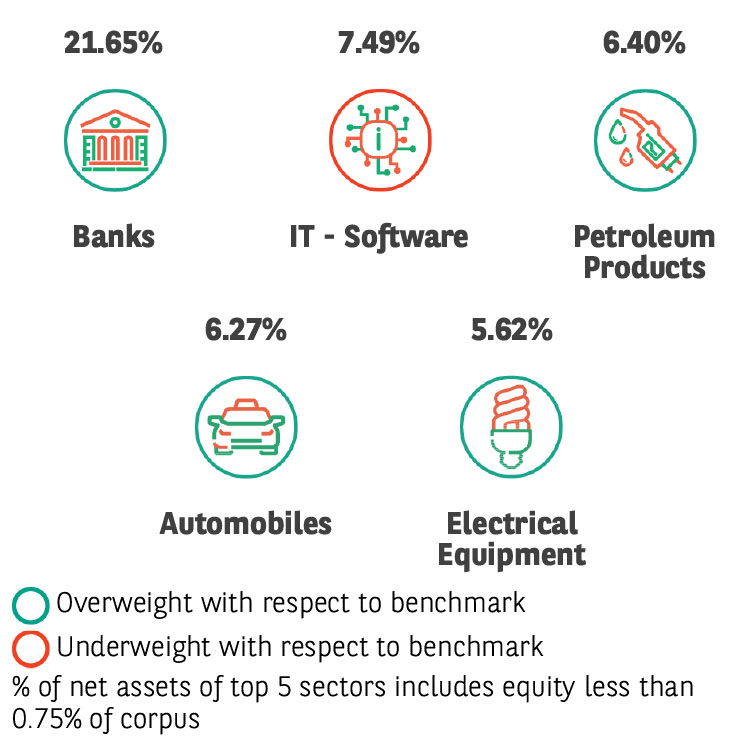
| EQUITY HOLDINGS | % of Net Assets | |
| Banks | 21.65% | |
| ✔HDFC Bank Limited | 7.23% | |
| ✔The Federal Bank Limited | 3.42% | |
| ✔IndusInd Bank Limited | 2.75% | |
| Canara Bank | 2.53% | |
| Karur Vysya Bank Limited | 2.22% | |
| ICICI Bank Limited | 2.00% | |
| Kotak Mahindra Bank Limited | 1.50% | |
| IT - Software | 7.49% | |
| ✔Infosys Limited | 3.73% | |
| Tech Mahindra Limited | 2.28% | |
| Persistent Systems Limited | 1.48% | |
| Petroleum Products | 6.40% | |
| ✔Reliance Industries Limited | 3.43% | |
| ✔Hindustan Petroleum Corporation Limited | 2.97% | |
| Automobiles | 6.27% | |
| Mahindra & Mahindra Limited | 2.25% | |
| Eicher Motors Limited | 2.04% | |
| Hyundai Motor India Ltd | 1.98% | |
| Electrical Equipment | 5.62% | |
| Bharat Heavy Electricals Limited | 2.37% | |
| Hitachi Energy India Limited | 1.93% | |
| GE Vernova T&D India Limited | 1.32% | |
| Retailing | 5.56% | |
| ✔Eternal Limited | 2.58% | |
| Vishal Mega Mart Limited | 1.96% | |
| FSN E-Commerce Ventures Limited | 1.02% | |
| Healthcare Services | 3.63% | |
| Max Healthcare Institute Limited | 2.27% | |
| Metropolis Healthcare Limited | 1.36% | |
| IT - Services | 3.57% | |
| Sagility Limited | 2.15% | |
| Amagi Media Labs Limited | 1.42% | |
| Chemicals & Petrochemicals | 3.29% | |
| Solar Industries India Limited | 2.21% | |
| Linde India Limited | 1.08% | |
| Telecom - Services | 3.22% | |
| ✔Bharti Airtel Limited | 3.22% | |
| Finance | 3.04% | |
| Shriram Finance Limited | 1.88% | |
| Poonawalla Fincorp Limited | 1.16% | |
| Construction | 2.90% | |
| ✔Larsen & Toubro Limited | 2.90% | |
| Ferrous Metals | 2.78% | |
| ✔Jindal Steel Limited | 2.78% | |
| Pharmaceuticals & Biotechnology | 2.70% | |
| Ajanta Pharma Limited | 1.59% | |
| Sun Pharmaceutical Industries Limited | 1.11% | |
| Consumer Durables | 2.51% | |
| Blue Star Limited | 1.62% | |
| Century Plyboards (India) Limited | 0.89% | |
| Cement & Cement Products | 2.34% | |
| UltraTech Cement Limited | 2.34% | |
| Beverages | 1.97% | |
| Radico Khaitan Limited | 1.97% | |
| Insurance | 1.93% | |
| ICICI Lombard General Insurance Company Limited | 1.93% | |
| Financial Technology (Fintech) | 1.63% | |
| One 97 Communications Limited | 1.63% | |
| Non - Ferrous Metals | 1.58% | |
| Hindalco Industries Limited | 1.58% | |
| Agricultural Food & other Products | 1.39% | |
| Tata Consumer Products Limited | 1.39% | |
| Industrial Manufacturing | 1.14% | |
| Kaynes Technology India Limited | 1.14% | |
| Auto Components | 0.89% | |
| Schaeffler India Limited | 0.89% | |
| Power | 0.83% | |
| NHPC Limited | 0.83% | |
| TOTAL EQUITY HOLDING | 94.33% | |
| FIXED INCOME HOLDINGS | Rating | % of Net Assets |
| Treasury Bill | 1.19% | |
| 364 Days Tbill (MD 17/09/2026) | SOV | 1.19% |
| Total Fixed Income Holdings | 1.19% | |
| TREPS, Cash & Other Net Current Assets | 4.48% | |
| GRAND TOTAL | 100.00% | |
Investment in Top 10 scrips constitutes 35.01% of the portfolio
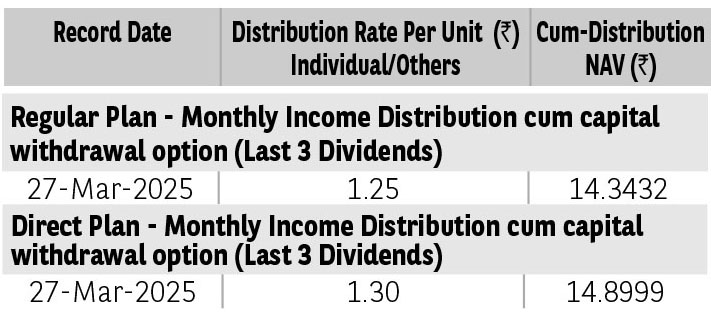
Pursuant to distribution under Income Distribution cum Capital Withdrawal (‘IDCW’) option, NAV of the IDCW option of the scheme(s) would fall to the extent of payout and statutory levy (if applicable). The
amounts under IDCW options can be distributed out of investors capital (Equalization Reserve), which is part of sale price that represents realized gains. Past performance may or may not be sustained in future.
The above stated distribution rate per unit is net distribution rate after deducting applicable taxes. The above distribution rates are on face value of ₹ 10 per unit.
| TER - Regular Plan (%) | 2.18% |
| TER - Direct Plan (%) | 1.01% |
| Portfolio Turnover Ratio | 0.85 |
| Standard Deviation* | 13.22% |
| Beta* | 0.97 |
| Sharpe Ratio* | 0.79 |
| No of Stocks | 45 |
| Portfolio RoE (%) | 13.21 |
| EPS Growth (%) | 30.04 |
➤ Wealth creation in long term.
➤ Investment in equity and equity related securities across market capitalizations
*Investors should consult their financial advisers if in doubt about whether the product is suitable for them.
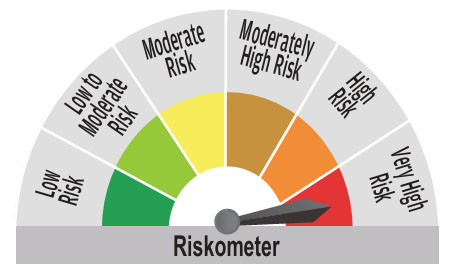
^^Riskometer For Scheme: basis it’s portfolio, ^Riskometer For Benchmark (Nifty 500 TRI): basis it’s constituents; As on January 30, 2026
For complete portfolio, kindly refer the website https://www.barodabnpparibasmf.in/
* refer Glossary page
Mutual Fund investments are subject to market risks, read all scheme related documents carefully.