(An open ended balanced advantage fund)
(An open ended balanced advantage fund)

The primary objective of the Scheme is to generate capital appreciation by investing in a portfolio of equity or equity linked securities while the secondary objective is to generate income through investments in debt and money market instruments. It also aims to manage risk through active asset allocation. However, there can be no assurance that the investment objectives of the Scheme will be realized. The Scheme does not guarantee/indicate any returns.
 NAV Details (As on July 31, 2024)
| Regular Plan - Growth Option | : ₹ 23.2841 |
| Regular Plan - IDCW Option | : ₹ 16.9582 |
| Direct Plan - Growth Option | : ₹ 25.1606 |
| Direct Plan - IDCW Option | : ₹ 18.3700 |
 Benchmark Index (Tier 1)
NIFTY 50 Hybrid Composite debt 50:50 Index
 Date of Allotment
November 14, 2018
 Fund Manager μ
| Category | Fund Manager | Managing fund since | Experience |
| Equity | Sanjay Chawla | 14-Nov-18 | 33 years |
| Equity | Pratish Krishnan | 05-Aug-21 | 23 years |
| Fixed Income | Prashant Pimple | 21-Oct-22 | 24 years |
 Load Structure
Entry Load
Exit Load: Upto 1 year • Redeemed or switched out upto 10% of the allotment: Nil • Redeemed or switched out more than 10% of the allotment: 1% After 1 year - Nil
For detailed load structure please refer Scheme Information Document of the scheme.
μ Dedicated Fund Manager for Overseas Investments: Mr. Miten Vora (managing fund since December 01, 2022)
Minimum Application Amount:
₹ 5,000 and in multiples of ₹ 1 thereafter.
Minimum Additional Application Amount:₹ 1,000 and in multiples of ₹ 1 thereafter
| Monthly AAUM## As on July 31, 2024 | : ₹ 4,009.18 Crores |
| AUM## As on July 31, 2024 | : ₹ 4,065.56 Crores |
## excluding inter-scheme Investments, if any, by other schemes of BNP Paribas Mutual Fund, as may be applicable
| EQUITY HOLDINGS | % of Net Assets | Derivatives % of Net Assets |
| Aerospace & Defense | 2.14% | -0.20% |
| ✔ Bharat Electronics Limited | 2.14% | -0.20% |
| Automobiles | 2.28% | |
| ✔ Tata Motors Limited | 2.28% | |
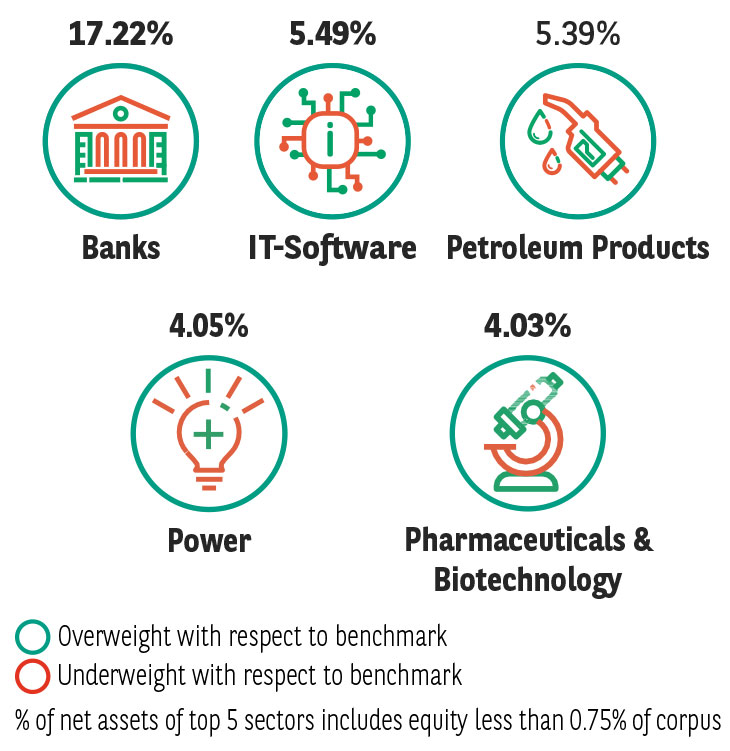
| Banks | 17.05% | -8.71% |
| ✔ Axis Bank Limited | 2.00% | -2.01% |
| Bank of Baroda | 1.00% | |
| ✔ HDFC Bank Limited | 4.71% | -1.47% |
| ✔ ICICI Bank Limited | 4.66% | -1.59% |
| IndusInd Bank Limited | 1.47% | -1.48% |
| Punjab National Bank | 0.91% | -0.92% |
| RBL Bank Limited | 1.07% | |
| State Bank of India | 1.23% | -1.24% |
| Capital Markets | 1.09% | |
| 360 One WAM Limited | 1.09% | |
| Construction | 4.01% | -0.77% |
| ✔ Larsen & Toubro Limited | 4.01% | -0.77% |
| Consumer Durables | 0.94% | |
| Titan Company Limited | 0.94% | |
| Electrical Equipment | 1.21% | |
| CG Power and Industrial Solutions Limited | 1.21% | |
| Ferrous Metals | 1.80% | |
| Jindal Stainless Limited | 0.91% | |
| Jindal Steel & Power Limited | 0.89% | |
| Finance | 1.76% | -0.11% |
| Cholamandalam Investment and Finance Company Ltd | 0.87% | -0.11% |
| PNB Housing Finance Limited | 0.89% | |
| Food Products | 0.85% | |
| Nestle India Limited | 0.85% | |
| Industrial Manufacturing | 0.89% | |
| Tega Industries Limited | 0.89% | |
| Industrial Products | 1.17% | |
| KEI Industries Limited | 1.17% | |
| IT - Software | 4.78% | -0.03% |
| ✔ Infosys Limited | 2.10% | -0.03% |
| ✔ Tata Consultancy Services Limited | 2.68% | |
| Petroleum Products | 5.39% | -2.81% |
| Hindustan Petroleum Corporation Limited | 1.07% | -1.08% |
| ✔ Reliance Industries Limited | 4.32% | -1.74% |
| Pharmaceuticals & Biotechnology | 2.62% | |
| Ajanta Pharma Limited | 1.25% | |
| Sun Pharmaceutical Industries Limited | 1.37% | |
| Power | 4.04% | -0.71% |
| ✔ NTPC Limited | 2.76% | -0.71% |
| Power Grid Corporation of India Limited | 1.28% | |
| Retailing | 1.78% | |
| Zomato Limited | 1.78% | |
| Telecom - Services | 2.60% | |
| Bharti Airtel Limited | 1.83% | |
| Indus Towers Limited | 0.77% | |
| Transport Services | 1.02% | |
| Container Corporation of India Limited | 1.02% | |
| EQUITY LESS THAN 0.75% OF CORPUS | 11.19% | -0.38% |
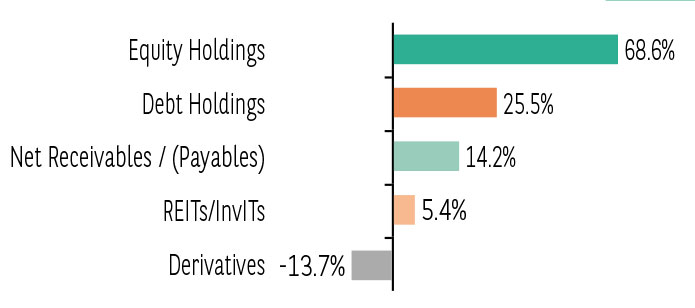
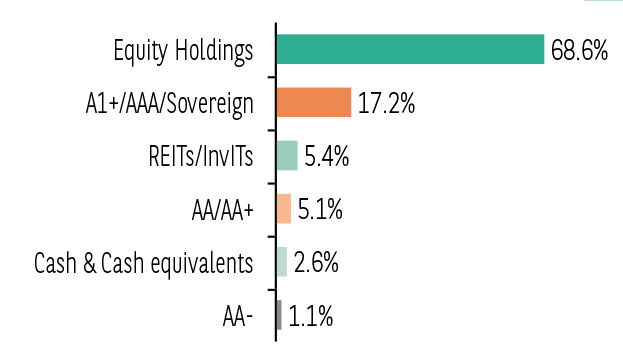
| Total Equity Holdings | 68.61% | -13.73% |
| REITs/InvITs Holdings | % of Net Assets | |
| Bharat Highways Invit | 1.22% | |
| India Grid Trust InvIT Fund | 0.68% | |
| Intelligent Supply Chain Infrastructure Trust | 0.99% | |
| NXT Infra Trust (NIT) | 1.25% | |
| Brookfield India Real Estate Trust | 1.27% | |
| Total REITs/InvITs Holdings | 5.41% | |
| Fixed Income Holdings | Rating | % of Net Assets |
| Government Bond | 5.02% | |
| 7.18% GOI (MD 14/08/2033) | Sovereign | 2.26% |
| 7.32% GOI (MD 13/11/2030) | Sovereign | 1.13% |
| 7.38% GOI (MD 20/06/2027) | Sovereign | 0.62% |
| 7.18% GOI (MD 24/07/2037) | Sovereign | 0.41% |
| 7.1% GOI (MD 08/04/2034) | Sovereign | 0.17% |
| 4.7% GOI FRB (MD 22/09/2033) | Sovereign | 0.10% |
| 7.37% GOI (MD 23/10/2028) | Sovereign | 0.09% |
| 7.06% GOI (MD 10/04/2028) | Sovereign | 0.09% |
| 6.68% GOI (MD 17/09/2031) | Sovereign | 0.06% |
| 7.26% GOI (MD 14/01/2029) | Sovereign | 0.05% |
| 7.17% GOI (MD 08/01/2028) | Sovereign | 0.04% |
| State Government Bond | 1.55% | |
| 6.58% Karnataka SDL (MD 03/06/2030) | Sovereign | 0.72% |
| 6.95% Gujarat SDL (MD 14/07/2031) | Sovereign | 0.61% |
| 7.18% Maharashtra SDL (MD 28/06/2029) | Sovereign | 0.12% |
| 8.57% Rajasthan SDL (MD 11/07/2028) | Sovereign | 0.05% |
| 8.08% Karnataka SDL (MD 26/12/2028) | Sovereign | 0.05% |
| Treasury Bill | 0.84% | |
| 182 Days Tbill (MD 26/09/2024) | Sovereign | 0.36% |
| 364 Days Tbill (MD 05/12/2024) | Sovereign | 0.24% |
| 364 Days Tbill (MD 21/11/2024) | Sovereign | 0.24% |
| Corporate Bond | 13.44% | |
| Andhra Pradesh State Beverages Corporation Limited | FITCH AA(CE) | 0.05% |
| Piramal Capital & Housing Finance Limited | ICRA AA | 2.44% |
| 360 One Prime Limited | CRISIL AA | 0.37% |
| Adani Ports and Special Economic Zone Limited | ICRA AAA | 0.12% |
| Bharat Sanchar Nigam Limited | CRISIL AAA(CE) | 0.45% |
| Embassy Office Parks REIT | CRISIL AAA | 0.12% |
| Export Import Bank of India | CRISIL AAA | 0.16% |
| Food Corporation Of India | CRISIL AAA(CE) | 0.08% |
| GAIL (India) Limited | CARE AAA | 0.12% |
| Godrej Industries Limited | CRISIL AA | 0.37% |
| Hindustan Petroleum Corporation Limited | CRISIL AAA | 0.42% |
| India Infradebt Limited | CRISIL AAA | 0.61% |
| IndoStar Capital Finance Limited | CRISIL AA- | 1.08% |
| Jamnagar Utilities & Power Private Limited | CRISIL AAA | 1.06% |
| JSW Steel Limited | ICRA AA | 0.17% |
| Larsen & Toubro Limited | CRISIL AAA | 0.37% |
| Muthoot Finance Limited | CRISIL AA+ | 1.22% |
| National Highways Authority Of India | CRISIL AAA | 0.01% |
| National Housing Bank | CRISIL AAA | 0.49% |
| Nuvoco Vistas Corporation Limited | CRISIL AA | 0.10% |
| Power Finance Corporation Limited | CRISIL AAA | 0.84% |
| REC Limited | CRISIL AAA | 0.68% |
| Reliance Industries Limited | CRISIL AAA | 0.26% |
| Small Industries Dev Bank of India | CRISIL AAA | 1.12% |
| Tata Capital Housing Finance Limited | CRISIL AAA | 0.36% |
| Torrent Power Limited | CRISIL AA+ | 0.37% |
| Yes Bank Limited | ICRA D | 0.00% |
| Certificate of Deposit | 1.23% | |
| Axis Bank Limited | CRISIL A1+ | 0.44% |
| Canara Bank | CRISIL A1+ | 0.14% |
| HDFC Bank Limited | CRISIL A1+ | 0.16% |
| Kotak Mahindra Bank Limited | CRISIL A1+ | 0.23% |
| National Bank For Agriculture and Rural Development | CRISIL A1+ | 0.26% |
| Certificate of Deposit | 1.25% | |
| Aditya Birla Finance Limited | ICRA A1+ | 0.24% |
| Kotak Mahindra Prime Limited | CRISIL A1+ | 0.21% |
| LIC Housing Finance Limited | CRISIL A1+ | 0.19% |
| National Housing Bank | ICRA A1+ | 0.61% |
| Total Fixed Income Holdings | 20.85% | |
| TREPS, Cash & Other Net Current Assets including Short futures | 2.65% | |
| GRAND TOTAL | 100.00% |
Investment in Top 10 scrips constitutes 31.66% of the portfolio
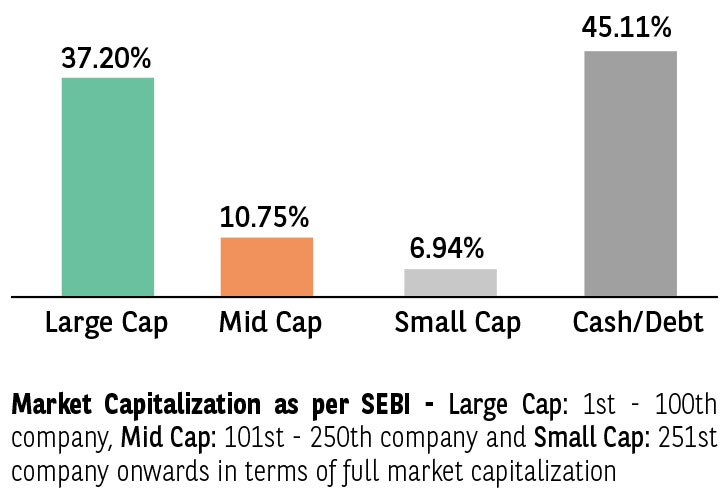
Net equity holdings is 54.88% of the portfolio
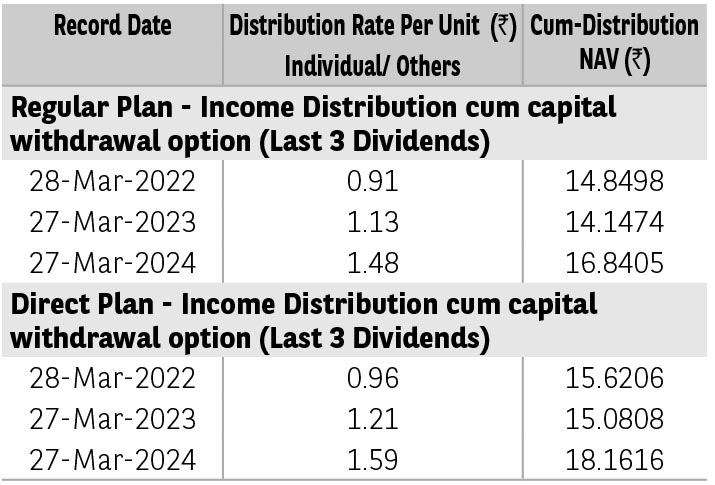
Pursuant to distribution under Income Distribution cum Capital Withdrawal (‘IDCW’) option, NAV of the IDCW option of the scheme(s) would fall to the extent of payout and statutory levy (if applicable). The
amounts under IDCW options can be distributed out of investors capital (Equalization Reserve), which is part of sale price that represents realized gains. Past performance may or may not be sustained in future.
The above stated distribution rate per unit is net distribution rate after deducting applicable taxes. The above distribution rates are on face value of ₹ 10 per unit.
| TER - Regular Plan (%) | 1.88 |
| TER - Direct Plan (%) | 0.70 |
| Portfolio Turnover Ratio | 1.90 |
| Standard Deviation* | 8.90% |
| Beta* | 1.18 |
| Sharpe Ratio* | 0.94 |
| Sharpe Ratio (annualised), Standard Deviation (annualised) and Beta are based on last 36 monthly data points. | |
* The information contained in this report has been obtained from sources considered to be authentic and reliable. This quantitative data does not purport to be an offer for purchase and sale of mutual fund units. The risk free rate of return considered for calculation of Sharpe ratio is 6.55%, as per 1 day MIBOR rate on the last business day of the month.
| Average Maturity (years) | 4.01 |
| Modified Duration (years) | 2.85 |
| YTM (%) | 7.87% |
| Macaulay Duration† (years) | 2.99 |
†Concept of Macaulay duration: The Macaulay Duration is a measure of a bond’s sensitivity to interest rate changes. It is expressed in annual terms. It is the weighted average term to maturity of the cash flows from a bond. The weight of each cash flow is determined by dividing the present value of the cash flow by the price. Factors like a bond’s price, maturity, coupon, yield to maturity among others impact the calculation of Macaulay duration. The Macaulay duration can be viewed as the economic balance point of a group of cash flows. Another way to interpret the statistic is that it is the weighted average number of years an investor must maintain a position in the bond until the present value of the bond’s cash flows equals the amount paid for the bond. As it provides a way to estimate the effect of certain market changes on a bond’s price, the investor can choose an investment that will better meet his future cash needs.
| Portfolio RoE (%) | 21.53 |
| EPS Growth (%) | 32.5 |
Portfolio RoE and EPS Growth is for trailing 12 months (TTM) whereas the number of stocks is as of July 31, 2024.
➤ Capital appreciation over medium to long term.
➤ Investments in equity and equity linked securities as well as debt and money market instruments while managing risk through active asset allocation.
*Investors should consult their financial advisers if in doubt about whether the product is suitable for them.
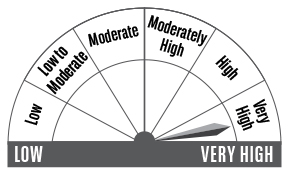
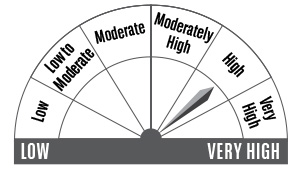
^^Riskometer For Scheme: basis it’s portfolio, For Benchmark (NIFTY 50 Hybrid Composite debt 50:50 Index): basis it’s constituents; As on July 31, 2024
For complete portfolio, kindly refer the website https://www.barodabnpparibasmf.in/
Mutual Fund investments are subject to market risks, read all scheme related documents carefully.