(An Open ended dynamic equity scheme investing across
large cap, mid cap, small cap companies)
(An Open ended dynamic equity scheme investing across
large cap, mid cap, small cap companies)

The Scheme seeks to generate long term capital appreciation by investing in a dynamic mix of equity and equity related instruments across market capitalizations. However, there can be no assurance that the investment objectives of the Scheme will be realized. The Scheme does not guarantee/indicate any returns.
 NAV Details (As on July 31, 2024 )
| Regular Plan - Growth Option | : ₹15.7741 |
| Regular Plan - IDCW Option | : ₹15.7741 |
| Direct Plan - Growth Option | : ₹16.2557 |
| Direct Plan - IDCW Option | : ₹16.2557 |
 Benchmark Index (Tier 1)
Nifty 500 Total Return Index
 Date of Allotment
August 17, 2022
 Fund Manager μ
| Fund Manager | Managing fund since | Experience |
| Sanjay Chawla | 17-Aug-22 | 33 years |
 Load Structure
Entry Load: Not Applicable
Exit Load: Upto 12 months • Redeemed or switched out upto
10% of the allotment: Nil • Redeemed or switched out more
than 10% of the allotment: 1% After 12 months - Nil
For detailed load structure please refer Scheme Information
Document of the scheme.
μ Dedicated Fund Manager for Overseas Investments: Mr. Miten Vora (managing fund since December 01, 2022)
Minimum Application Amount:
₹ 5,000 and in multiples of ₹ 1
thereafter.
Minimum Additional Application Amount:₹ 1,000 and in
multiples of ₹ 1 thereafter.
| Monthly AAUM## As on July 31, 2024 | : ₹ 1,353.45 Crores |
| AUM## As on July 31, 2024 | : ₹ 1,369.11 Crores |
## excluding inter-scheme Investments, if any, by other schemes of Baroda BNP Paribas Mutual Fund, as may be applicable
| EQUITY HOLDINGS | % of Net Assets | |
| AEROSPACE & DEFENSE | 1.08% | |
| Hindustan Aeronautics Limited | 1.08% | |
| AUTO COMPONENTS | 3.20% | |
| Bosch Limited | 2.04% | |
| ZF Commercial Vehicle Control Systems India Limited | 1.16% | |
| AUTOMOBILES | 3.17% | |
| ✔ Tata Motors Limited | 3.17% | |
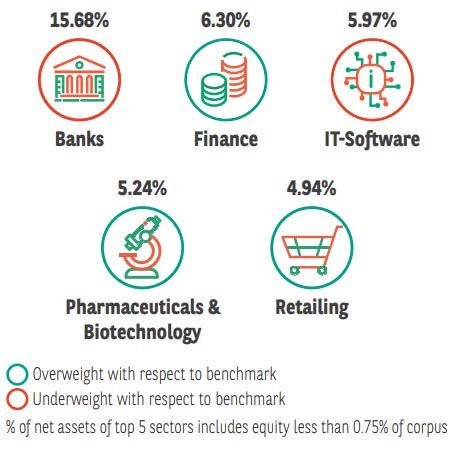
| BANKS | 15.68% | |
| Axis Bank Limited | 1.62% | |
| Bank of Baroda | 1.85% | |
| ✔ HDFC Bank Limited | 4.13% | |
| ✔ ICICI Bank Limited | 3.55% | |
| Indian Bank | 1.22% | |
| RBL Bank Limited | 1.03% | |
| The Federal Bank Limited | 2.28% | |
| CAPITAL MARKETS | 1.17% | |
| Angel One Limited | 1.17% | |
| CHEMICALS & PETROCHEMICALS | 2.38% | |
| Linde India Limited | 2.38% | |
| CONSTRUCTION | 3.48% | |
| ✔ Larsen & Toubro Limited | 3.48% | |
| CONSUMER DURABLES | 1.26% | |
| Titan Company Limited | 1.26% | |
| ELECTRICAL EQUIPMENT | 4.12% | |
| Bharat Heavy Electricals Limited | 1.15% | |
| ✔ Hitachi Energy India Limited | 2.97% | |
| FERROUS METALS | 3.96% | |
| Jindal Stainless Limited | 2.16% | |
| Jindal Steel & Power Limited | 1.80% | |
| FINANCE | 6.30% | |
| Cholamandalam Investment and Finance Company Ltd | 1.76% | |
| Indian Railway Finance Corporation Limited | 0.99% | |
| PNB Housing Finance Limited | 1.82% | |
| Power Finance Corporation Limited | 1.73% | |
| FINANCIAL TECHNOLOGY (FINTECH) | 1.86% | |
| PB Fintech Limited | 1.86% | |
| FOOD PRODUCTS | 2.89% | |
| Mrs. Bectors Food Specialities Limited | 1.28% | |
| Nestle India Limited | 1.61% | |
| HEALTHCARE SERVICES | 2.24% | |
| Indegene Limited | 0.86% | |
| Max Healthcare Institute Limited | 1.38% | |
| INDUSTRIAL MANUFACTURING | 2.60% | |
| ✔ Kaynes Technology India Limited | 2.60% | |
| INDUSTRIAL PRODUCTS | 2.63% | |
| Cummins India Limited | 1.07% | |
| Ratnamani Metals & Tubes Limited | 1.56% | |
| IT - SOFTWARE | 5.97% | |
| ✔ Infosys Limited | 3.41% | |
| Tata Consultancy Services Limited | 2.56% | |
| OIL | 2.21% | |
| Oil India Limited | 2.21% | |
| PERSONAL PRODUCTS | 1.05% | |
| Godrej Consumer Products Limited | 1.05% | |
| PETROLEUM PRODUCTS | 2.97% | |
| ✔ Reliance Industries Limited | 2.97% | |
| PHARMACEUTICALS & BIOTECHNOLOGY | 5.24% | |
| Ajanta Pharma Limited | 2.54% | |
| Alembic Pharmaceuticals Limited | 1.38% | |
| Sun Pharmaceutical Industries Limited | 1.32% | |
| POWER | 4.64% | |
| ✔ NTPC Limited | 2.73% | |
| Power Grid Corporation of India Limited | 1.91% | |
| REALTY | 3.30% | |
| Mahindra Lifespace Developers Limited | 1.33% | |
| The Phoenix Mills Limited | 1.97% | |
| RETAILING | 4.94% | |
| FSN E-Commerce Ventures Limited | 1.41% | |
| Trent Limited | 1.60% | |
| Zomato Limited | 1.93% | |
| TELECOM - SERVICES | 4.74% | |
| ✔ Bharti Airtel Limited | 3.00% | |
| Indus Towers Limited | 1.74% | |
| TRANSPORT INFRASTRUCTURE | 2.23% | |
| GMR Airports Infrastructure Limited | 2.23% | |
| LESS THAN 0.75% EXPOSURE | 0.65% | |
| Radico Khaitan Limited | 0.65% | |
| Total Equity Holdings | 95.96% | |
| Fixed Income Holdings | % of Net Assets | |
| TREPS, Cash & Other Net Current Assets | 4.04% | |
| GRAND TOTAL | 100.00% |
Investment in Top 10 scrips constitutes 32.01% of the portfolio
| TER - Regular Plan (%) | 2.15 |
| TER - Direct Plan (%) | 0.93 |
| Portfolio Turnover Ratio | 0.82 |
*The information contained in this report has been obtained from sources considered to be authentic and reliable. This quantitative data does not purport to be an offer for purchase and sale of mutual fund units.
| Portfolio RoE (%) | 18.84 |
| EPS Growth (%) | 34.15 |
Portfolio RoE and EPS Growth is for trailing 12 months (TTM) whereas the number of stocks is as of July 31, 2024
➤ Wealth creation in long term.
➤ Investment in equity and equity related securities across market capitalizations
*Investors should consult their financial advisers if in doubt about whether the product is suitable for them.
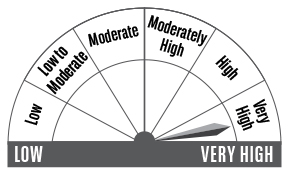
^^Riskometer For Scheme: basis it’s portfolio, For Benchmark (Nifty 500 Total Return Index (TRI)): basis it’s constituents; As on July 31, 2024
Mutual Fund investments are subject to market risks, read all scheme related documents carefully.