(An Open ended Scheme investing in arbitrage opportunities)
(An Open ended Scheme investing in
arbitrage opportunities)



The primary investment objective of the scheme is to generate income and capital appreciation by investing in a combination of diversified portfolio of equity and equity related instruments, including use of equity derivatives strategies and arbitrage opportunities with exposure in debt and fixed income instruments. However, there can be no assurance that the investment objectives of the Scheme will be realized. The Scheme does not guarantee/indicate any returns.
 NAV Details (As on June 30, 2026)
| Regular Plan - Quarterly IDCW Option | : ₹ 10.7344 |
| Regular Plan - Monthly IDCW Option | : ₹ 10.5594 |
| Regular Plan - Growth Option | : ₹ 16.9371 |
| Regular Plan - Adhoc IDCW Option | : ₹ 11.0536 |
| Direct Plan - Quarterly IDCW Option | : ₹ 10.8958 |
| Direct Plan - Monthly IDCW Option | : ₹ 10.8234 |
| Direct Plan - Growth Option | : ₹ 18.0328 |
| Direct Plan - Adhoc IDCW Option | : ₹ 11.5229 |
 Benchmark Index (Tier 1)
Nifty 50 Arbitrage Index
 Date of Allotment
December 28, 2016
 Fund Manager^^
 | Category | Fund Manager | Managing fund since | Experience |
| Equity | Mr. Neeraj Saxena | 14-Mar-22 | 20 years |
| Equity | Ms. Meenakshi Gururaj | 01-May-26 | 17 years |
| Fixed Income | Mr. Vikram Pamnani | 16-Mar-22 | 14 years |
^^Ms. Meenakshi Gururaj was appointed as Fund Manager w.e.f May 1, 2026.
 Load Structure
Exit Load: • If units of the Scheme are redeemed or
switched out within 15 days from the date of allotment –
0.25% of the applicable NAV. • If units of the Scheme are
redeemed or switched out after 15 days from the date of
allotment: Nil
For detailed load structure please refer Scheme
Information Document.
Minimum Application Amount:
₹ 5,000 and in multiples of ₹ 1 thereafter.
Minimum Additional Application Amount:₹ 1,000 and in multiples of ₹ 1 thereafter
| Monthly AAUM## As on June 30, 2026 | : ₹ 1,228.60 Crores |
| AUM## As on June 30, 2026 | : ₹ 1,146.77 Crores |
## including inter-scheme Investments, if any, by other schemes of BNP Paribas Mutual Fund, as may be applicable
| EQUITY HOLDINGS | % of Net Assets | Derivatives |
| Banks | 15.63% | -15.72% |
| ✔ Bandhan Bank Limited | 3.59% | -3.61% |
| ✔ HDFC Bank Limited | 3.41% | -3.43% |
| ICICI Bank Limited | 2.08% | -2.09% |
| Yes Bank Limited | 1.95% | -1.96% |
| State Bank of India | 1.61% | -1.62% |
| RBL Bank Limited | 1.28% | -1.29% |
| Punjab National Bank | 0.88% | -0.88% |
| Kotak Mahindra Bank Limited | 0.83% | -0.84% |
| Power | 6.66% | -6.71% |
| ✔ Adani Energy Solutions Limited | 3.71% | -3.74% |
| ✔ Adani Green Energy Limited | 2.95% | -2.97% |
| Finance | 5.73% | -5.77% |
| Manappuram Finance Limited | 2.49% | -2.51% |
| PNB Housing Finance Limited | 2.36% | -2.38% |
| Jio Financial Services Limited | 0.88% | -0.88% |
| Telecom - Services | 5.29% | -5.32% |
| ✔ Vodafone Idea Limited | 4.50% | -4.52% |
| Indus Towers Limited | 0.79% | -0.80% |
| Ferrous Metals | 3.67% | -3.69% |
| ✔ Steel Authority of India Limited | 2.72% | -2.74% |
| JSW Steel Limited | 0.95% | -0.95% |
| Pharmaceuticals & Biotechnology | 3.57% | -3.59% |
| ✔ Glenmark Pharmaceuticals Limited | 2.75% | -2.76% |
| Cipla Limited | 0.82% | -0.83% |
| Minerals & Mining | 2.99% | -3.01% |
| ✔ NMDC Limited | 2.99% | -3.01% |
| Consumer Durables | 1.80% | -1.81% |
| Kalyan Jewellers India Limited | 1.80% | -1.81% |
| Aerospace & Defense | 1.80% | -1.81% |
| Bharat Electronics Limited | 1.80% | -1.81% |
| Transport Infrastructure | 1.35% | -1.36% |
| GMR Airports Limited | 1.35% | -1.36% |
| Electrical Equipment | 1.32% | -1.33% |
| Inox Wind Limited | 1.32% | -1.33% |
| Realty | 1.10% | -1.11% |
| Lodha Developers Limited | 1.10% | -1.11% |
| Transport Services | 1.01% | -1.02% |
| Container Corporation of India Limited | 1.01% | -1.02% |
| Retailing | 0.87% | -0.87% |
| Info Edge (India) Limited | 0.87% | -0.87% |
| Automobiles | 0.86% | -0.87% |
| Maruti Suzuki India Limited | 0.86% | -0.87% |
| Metals & Minerals Trading | 0.81% | -0.81% |
| Adani Enterprises Limited | 0.81% | -0.81% |
| Auto Components | 0.79% | -0.79% |
| Exide Industries Limited | 0.79% | -0.79% |
| LESS THAN 0.75% EXPOSURE | 12.36% | -11.92% |
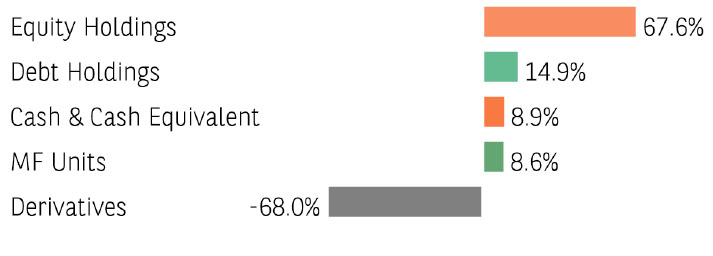
| TOTAL EQUITY HOLDING | 67.61% | -67.51% |
| MUTUAL FUND UNITS | % of Net Assets | |
| Baroda BNP Paribas Liquid Fund | 4.37% | |
| Baroda BNP Paribas Ultra Short Dur Fund | 2.37% | |
| Baroda BNP Paribas Money | 1.88% | |
| Total MUTUAL FUND UNITS | 8.62% | |
| FIXED INCOME HOLDINGS | Rating | % of Net Assets |
| TREASURY BILL | 14.86% | |
| ✔ 182 Days Tbill (MD 19/11/2026) | Sovereign | 4.27% |
| 364 Days Tbill (MD 11/03/2027) | Sovereign | 4.20% |
| 182 Days Tbill (MD 03/09/2026) | Sovereign | 2.16% |
| 364 Days Tbill (MD 26/11/2026) | Sovereign | 2.13% |
| 364 Days Tbill (MD 19/03/2027) | Sovereign | 2.10% |
| CORPORATE BOND | 0.00% | |
| Total Fixed Income Holdings | 14.86% | |
| TREPS, Cash & Other Net Current Assets | 8.91% | |
| GRAND TOTAL | 100.00% |
Investment in Top 10 scrips constitutes 35.09% of the portfolio
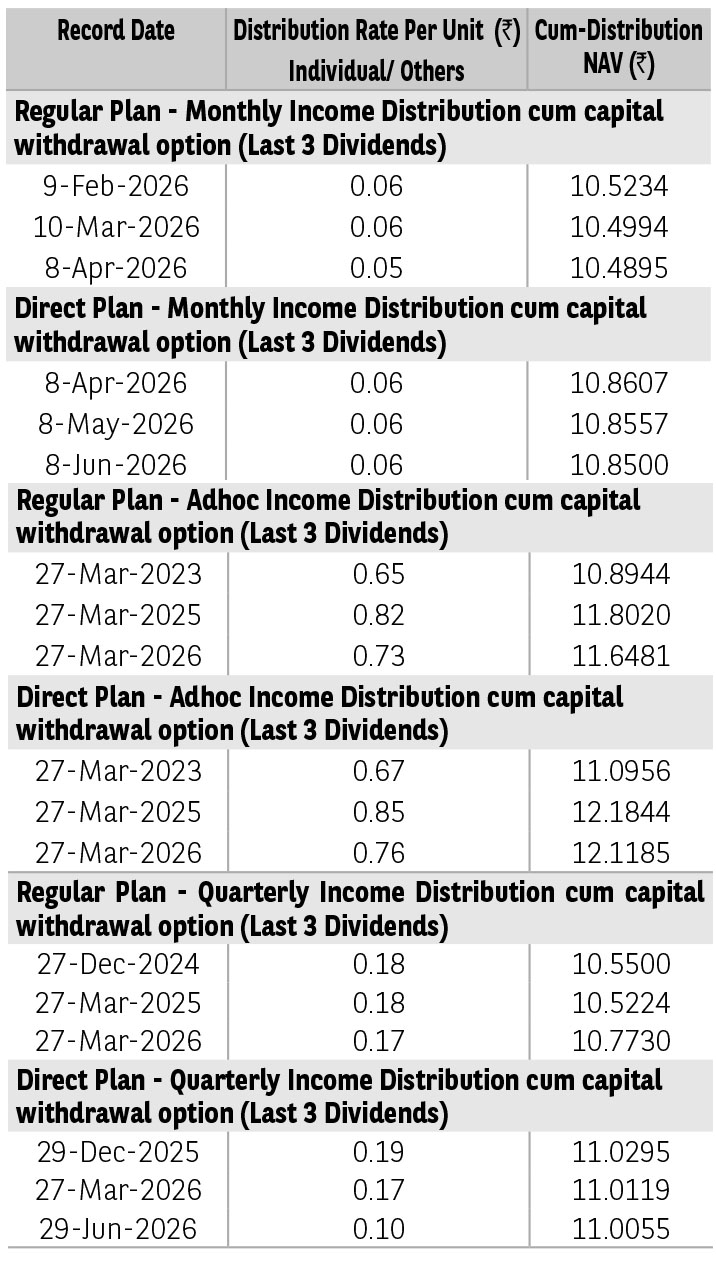
Pursuant to distribution under Income Distribution cum Capital Withdrawal (‘IDCW’) option, NAV of the IDCW option of the scheme(s) would fall to the extent of payout and statutory levy (if applicable).
The
amounts under IDCW options can be distributed out of investors capital (Equalization Reserve), which is part of sale price that represents realized gains. Past performance may or may not be sustained in future.
The above stated distribution rate per unit is net distribution rate after deducting applicable taxes. The above distribution rates are on face value of ₹ 10 per unit, except for Baroda BNP Paribas Liquid Fund where
the face value is ₹ 1,000 per unit.
| BER - Regular Plan (%) | 0.96% |
| BER - Direct Plan (%) | 0.30% |
| Equity Portfolio Turnover Ratio# | 2.16 |
| Total Portfolio Turnover Ratio | 12.61 |
| Standard Deviation* | 0.53% |
| Beta* | 0.59 |
| Sharpe Ratio* | 2.18 |
| Sharpe Ratio (annualised), Standard Deviation (annualised) and Beta are based on last 36 monthly data points. | |
The Total Expense Ratio (TER) is the sum of the Base
Expense Ratio (BER), brokerage fees, transaction costs, and
statutory levies.
#Equity portfolio turnover ratio excludes transactions in
derivatives. Total Portfolio Turnover ratio is sum of Equity,
Debt, and Derivative.
The risk free rate of return considered for calculation of Sharpe ratio is 5.50%, as per 1 day MIBOR rate on the last business day of the month.
| Average Maturity (years) | 0.36 |
| Modified Duration (years) | 0.35 |
| YTM (%) | 5.75% |
| Macaulay Duration† (years) | 0.34 |
†Concept of Macaulay duration: The Macaulay Duration is a measure of a bond’s sensitivity to interest rate changes. It is expressed in annual terms. It is the weighted average term to maturity of the cash flows from a bond. The weight of each cash flow is determined by dividing the present value of the cash flow by the price. Factors like a bond’s price, maturity, coupon, yield to maturity among others impact the calculation of Macaulay duration. The Macaulay duration can be viewed as the economic balance point of a group of cash flows. Another way to interpret the statistic is that it is the weighted average number of years an investor must maintain a position in the bond until the present value of the bond’s cash flows equals the amount paid for the bond. As it provides a way to estimate the effect of certain market changes on a bond’s price, the investor can choose an investment that will better meet his future cash needs.
➤ Wealth creation in long term.
➤ Investment in a diversified portfolio of equity and equity related instruments, including use of equity derivatives strategies and arbitrage opportunities with exposure in debt & money market instruments.
*Investors should consult their financial advisers if in doubt about whether the product is suitable for them.
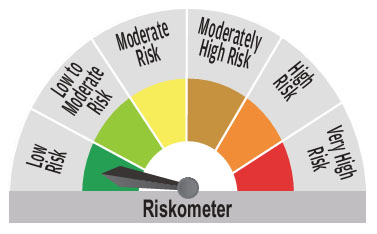
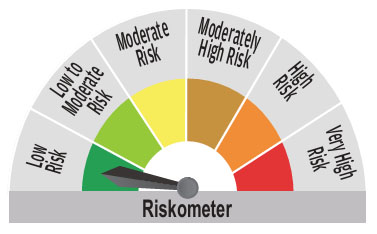
^^Riskometer For Scheme: basis it’s portfolio, ^Riskometer For Benchmark (Nifty 50 Arbitrage Index): basis it’s constituents; As on June 30, 2026
For complete portfolio, kindly refer the website https://www.barodabnpparibasmf.in/
* refer Glossary page
Mutual Fund investments are subject to market risks, read all scheme related documents carefully.