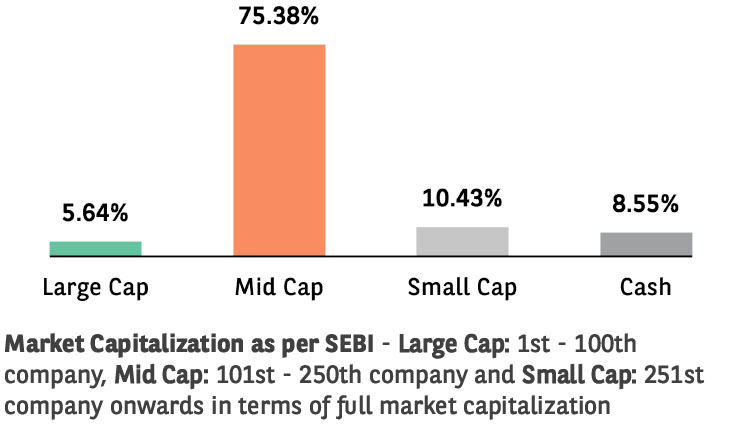
(An Open ended Equity Scheme predominantly investing
in mid cap stocks)
(An Open ended Equity Scheme predominantly investing
in mid cap stocks)

The investment objective of the Scheme seeks to generate long-term capital appreciation by investing primarily in companies with high growth opportunities in the mid capitalization segment. The fund will emphasize on companies that appear to offer opportunities for longterm growth and will be inclined towards companies that are driven by dynamic style of management and entrepreneurial flair. However, there can be no assurance that the investment objectives of the Scheme will be realized. The Scheme does not guarantee/indicate any returns.
 NAV Details (As on May 30, 2025)
| Regular Plan - IDCW Option | : ₹56.2003 |
| Regular Plan - Growth Option | : ₹98.8681 |
| Direct Plan - IDCW Option | : ₹70.9050 |
| Direct Plan - Growth Option | : ₹117.4514 |
 Benchmark Index (Tier 1)
Nifty Midcap 150 TRI
 Date of Allotment
May 02, 2006
 Fund Manager
 | Fund Manager | Managing fund since | Experience |
| Shiv Chanani | 13-Jul-22 | 21 years |
| Mr. Himanshu Singh | 21-Oct-24 | 10 years |
 Load Structure
Exit Load: • If units of the Scheme are redeemed or
switched out up to 10% of the units (the limit) within 12
months from the date of allotment - Nil; • If units of the
scheme are redeemed or switched out in excess of the limit
within 12 months from the date of allotment - 1% of the
applicable NAV; • If units of scheme are redeemed or
switched out after 12 months from the date of allotment -
Nil.
For detailed load structure please refer Scheme
Information Document.
Minimum Amount: Lumpsum investment:
₹ 5,000 and in multiples of ₹ 1
thereafter.
Minimum Additional Application Amount:₹ 1,000 and in
multiples of ₹ 1 thereafter.
| Monthly AAUM## As on May 30, 2025 | : ₹2,082.07 Crores |
| AUM## As on May 30, 2025 | : ₹ 2,136.80 Crores |
## including inter-scheme Investments, if any, by other schemes of Baroda BNP Paribas Mutual Fund, as may be applicable
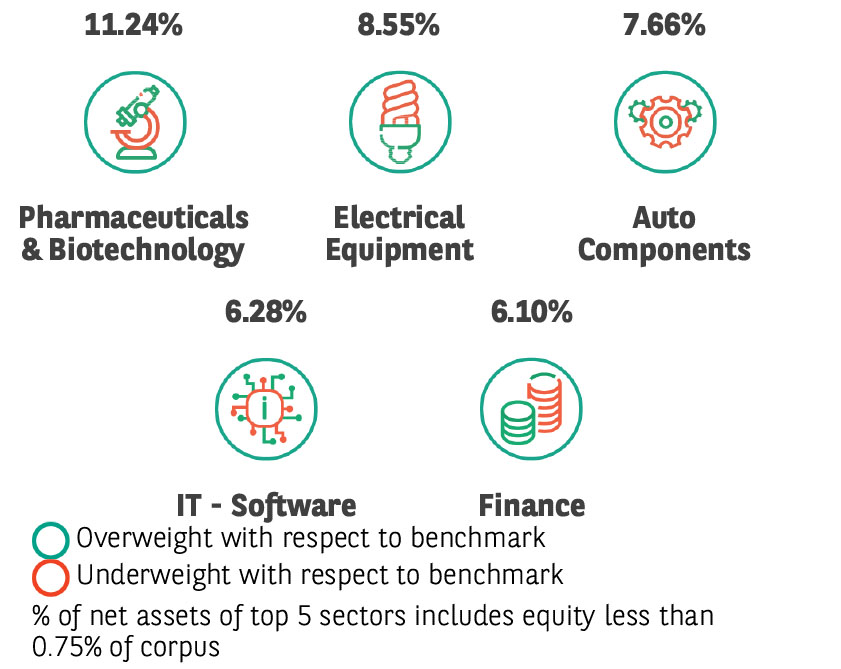
| EQUITY HOLDINGS | % of Net Assets | |
| Pharmaceuticals & Biotechnology | 11.24% | |
| ✔ GlaxoSmithKline Pharmaceuticals Limited | 2.11% | |
| Abbott India Limited | 2.00% | |
| Alkem Laboratories Limited | 1.91% | |
| IPCA Laboratories Limited | 1.87% | |
| Sanofi India Limited | 1.22% | |
| Zydus Lifesciences Limited | 1.09% | |
| Sanofi Consumer Healthcare India Limited | 1.04% | |
| Electrical Equipment | 8.55% | |
| ✔ Hitachi Energy India Limited | 2.71% | |
| ✔ GE Vernova T&D India Limited | 2.62% | |
| ✔ Bharat Heavy Electricals Limited | 2.19% | |
| Thermax Limited | 1.03% | |
| Auto Components | 7.66% | |
| Schaeffler India Limited | 1.76% | |
| Exide Industries Limited | 1.63% | |
| ZF Commercial Vehicle Control Systems India Limited | 1.56% | |
| Bosch Limited | 1.03% | |
| Jtekt India Limited | 0.87% | |
| MRF Limited | 0.81% | |
| IT - Software | 6.28% | |
| ✔ KPIT Technologies Limited | 2.19% | |
| Persistent Systems Limited | 2.11% | |
| Oracle Financial Services Software Limited | 1.98% | |
| Banks | 5.68% | |
| ✔ The Federal Bank Limited | 2.36% | |
| ✔ Indian Bank | 2.31% | |
| Yes Bank Limited | 1.01% | |
| Finance | 5.47% | |
| LIC Housing Finance Limited | 1.95% | |
| Sundaram Finance Limited | 1.92% | |
| CRISIL Limited | 1.60% | |
| Insurance | 4.29% | |
| ICICI Prudential Life Insurance Company Limited | 1.55% | |
| ICICI Lombard General Insurance Company Limited | 1.54% | |
| Max Financial Services Limited | 1.20% | |
| Fertilizers & Agrochemicals | 3.61% | |
| Coromandel International Limited | 1.82% | |
| PI Industries Limited | 1.79% | |
| Cement & Cement Products | 3.40% | |
| Shree Cement Limited | 1.52% | |
| JK Lakshmi Cement Limited | 0.99% | |
| The India Cements Limited | 0.89% | |
| Healthcare Services | 3.23% | |
| Fortis Healthcare Limited | 1.65% | |
| Max Healthcare Institute Limited | 1.58% | |
| Agricultural, Commercial & Construction Vehicles | 3.03% | |
| Escorts Kubota Limited | 1.87% | |
| Ashok Leyland Limited | 1.16% | |
| Financial Technology (Fintech) | 2.47% | |
| ✔ PB Fintech Limited | 2.47% | |
| Realty | 2.34% | |
| ✔ The Phoenix Mills Limited | 2.34% | |
| Petroleum Products | 2.12% | |
| ✔ Hindustan Petroleum Corporation Limited | 2.12% | |
| Agricultural Food & other Products | 1.99% | |
| AWL Agri Business Limited | 1.99% | |
| Chemicals & Petrochemicals | 1.99% | |
| Navin Fluorine International Limited | 1.99% | |
| Beverages | 1.85% | |
| United Breweries Limited | 1.85% | |
| Automobiles | 1.74% | |
| TVS Motor Company Limited | 0.98% | |
| Ola Electric Mobility Ltd | 0.76% | |
| Personal Products | 1.40% | |
| Procter & Gamble Hygiene and Health Care Limited | 1.40% | |
| Consumer Durables | 1.24% | |
| Metro Brands Limited | 1.24% | |
| Textiles & Apparels | 1.19% | |
| Page Industries Limited | 1.19% | |
| Non - Ferrous Metals | 1.10% | |
| National Aluminium Company Limited | 1.10% | |
| Telecom - Services | 1.07% | |
| Bharti Hexacom Limited | 1.07% | |
| Food Products | 1.06% | |
| Hatsun Agro Product Limited | 1.06% | |
| Retailing | 1.00% | |
| Info Edge (India) Limited | 1.00% | |
| Oil | 1.00% | |
| Oil India Limited | 1.00% | |
| Diversified | 0.96% | |
| 3M India Limited | 0.96% | |
| Gas | 0.93% | |
| Petronet LNG Limited | 0.93% | |
| IT - Services | 0.89% | |
| Inventurus Knowledge Solutions Limited | 0.89% | |
| Leisure Services | 0.81% | |
| The Indian Hotels Company Limited | 0.81% | |
| LESS THAN 0.75% EXPOSURE | 1.92% | |
| TOTAL EQUITY HOLDING | 91.51% | |
| FIXED INCOME HOLDINGS | Rating | % of Net Assets |
| Treasury Bill | 0.91% | |
| 364 Days Tbill (MD 18/12/2025) | SOV | 0.91% |
| Total Fixed Income Holdings | 0.91% | |
| TREPS, Cash & Other Net Current Assets | 7.58% | |
| GRAND TOTAL | 100.00% |
Investment in Top 10 scrips constitutes 23.42% of the portfolio
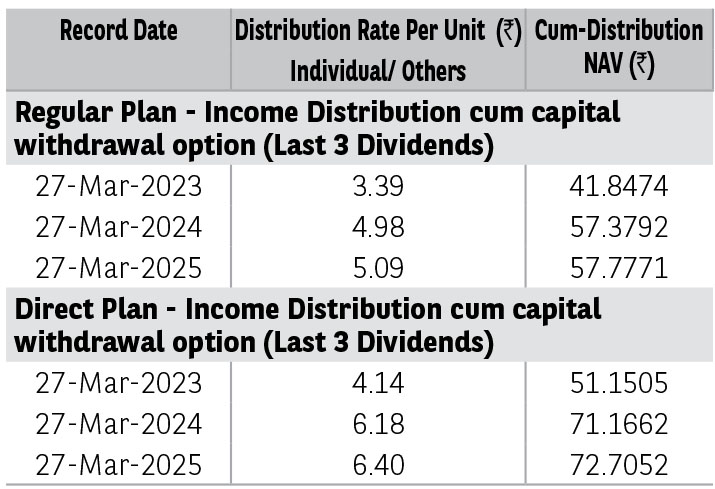
Pursuant to distribution under Income Distribution cum Capital Withdrawal (‘IDCW’) option, NAV of the IDCW option of the scheme(s) would fall to the extent of payout and statutory levy (if applicable). The amounts under IDCW options can be distributed out of investors capital (Equalization Reserve), which is part of sale price that represents realized gains. Past performance may or may not be sustained in future. The above stated distribution rate per unit is net distribution rate after deducting applicable taxes. The above distribution rates are on face value of ₹ 10 per unit.
| TER - Regular Plan (%) | 2.01% |
| TER - Direct Plan (%) | 0.57% |
| Portfolio Turnover Ratio | 0.96 |
| Standard Deviation*†† | 14.39% |
| Beta*†† | 0.82 |
| Sharpe Ratio*†† | 1.13 |
| Sharpe Ratio (annualised), Standard Deviation (annualised) and Beta are based on last 36 monthly data points. | |
| †† The scheme is a ‘Transferee Scheme’, and accordingly, the ratios are being provided considering the weighted average NAVs of both the Transferor Scheme and Transferee Scheme. | |
* The information contained in this report has been obtained from sources considered to be authentic and reliable. This quantitative data does not purport to be an offer for purchase and sale of mutual
fund units.
The risk free rate of return considered for calculation of Sharpe ratio is 5.86%, as per 1 day MIBOR rate on the last business day of the month.
| No of Stocks | 63 |
| Portfolio RoE (%) | 16.11 |
| EPS Growth (%) | 23.52 |
➤ Wealth Creation in long term.
➤ Investments in companies in mid capitalization segment.
*Investors should consult their financial advisers if in doubt about whether the product is suitable for them.
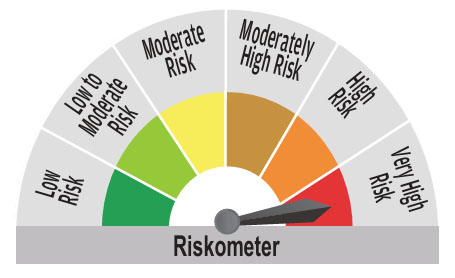
^^Riskometer For Scheme: basis it’s portfolio, ^Riskometer For Benchmark (Nifty Midcap 150 TRI): basis it’s constituents; As on May 30, 2025
For complete portfolio, kindly refer the website https://www.barodabnpparibasmf.in/
Mutual Fund investments are subject to market risks, read all scheme related documents carefully.