[An open-ended retirement solution-oriented
scheme having a lock-in of 5 years or till
retirement age (whichever is earlier)]
[An open-ended retirement solution-oriented
scheme having a lock-in of 5 years or till
retirement age (whichever is earlier)]

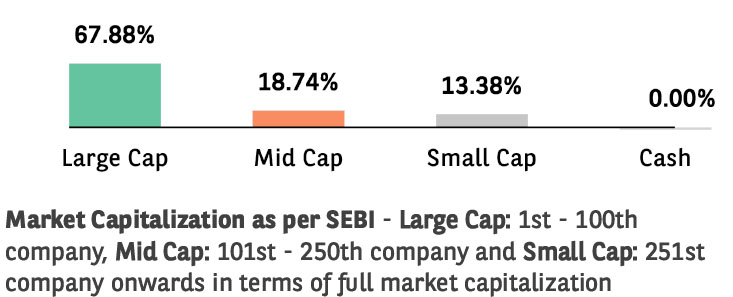
The primary investment objective of the Scheme is to generate income and capital appreciation by investing in a diversifi ed portfolio of equity and equity related instruments and fixed income instruments with a view to provide a retirement solution to investors. However, there can be no assurance that the investment objective of the Scheme will be realized. The Scheme does not guarantee/indicate any returns.
 NAV Details (As on May 30, 2025)
| Regular IDCW | : 10.9809 |
| Regular Growth | : 10.9809 |
| Direct IDCW | : 11.2033 |
| Direct Growth | : 11.2033 |
 Benchmark Index (Tier 1)
CRISIL Hybrid 35+65 Aggressive Index
 Date of Allotment
May 28, 2024
 Fund Manager
 | Category | Fund Manager | Managing fund since | Experience |
| Equity | Mr. Pratish Krishnan | 28-May-24 | 23 years |
| Equity | Mr. Ankeet Pandya | 01-Jan-25 | 11 years |
| Fixed Income | Mr. Gurvinder Singh Wasan | 21-Oct-24 | 21 years |
 Load Structure
Exit Load: • No Exit Load shall be imposed for switching
between Investment Plan(s) and Plans/Options within the
Investment Plan(s), subject to completion of lock-in period
For detailed load structure please refer Scheme
Information Document.
Minimum Amount: Lumpsum investment:
₹ 1,000 and in multiples of ₹ 1
thereafter.
Minimum Additional Application Amount:₹ 1,000 and in
multiples of ₹ 1 thereafter.
| Monthly AAUM## As on May 30, 2025 | : ₹ 378.99 Crores |
| AUM## As on May 30, 2025 | : ₹ 381.68 Crores |
## including inter-scheme Investments, if any, by other schemes of Baroda BNP Paribas Mutual Fund, as may be applicable
| EQUITY HOLDINGS | % of Net Assets | |
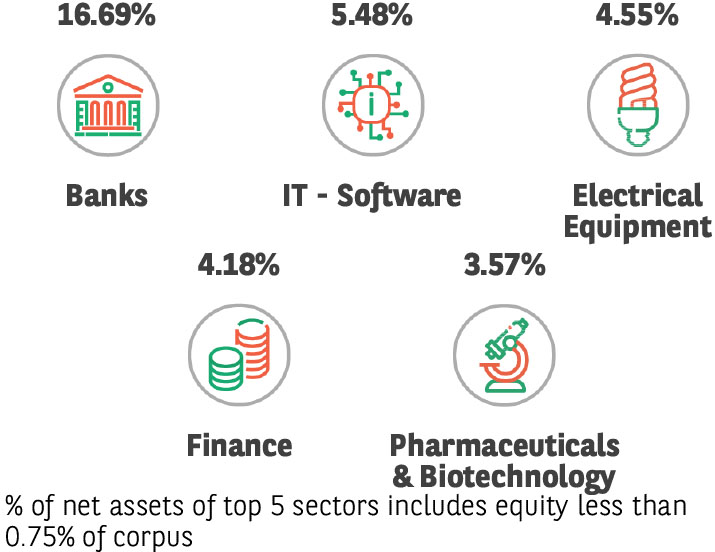
| Banks | 16.69% | |
| ✔ HDFC Bank Limited | 5.61% | |
| ✔ ICICI Bank Limited | 4.43% | |
| Kotak Mahindra Bank Limited | 1.36% | |
| Bank of Baroda | 1.27% | |
| AU Small Finance Bank Limited | 1.20% | |
| Axis Bank Limited | 1.09% | |
| State Bank of India | 0.96% | |
| City Union Bank Limited | 0.77% | |
| IT - Software | 5.15% | |
| ✔ Infosys Limited | 2.32% | |
| Tech Mahindra Limited | 1.03% | |
| Persistent Systems Limited | 0.92% | |
| LTIMindtree Limited | 0.88% | |
| Electrical Equipment | 4.55% | |
| ✔ Hitachi Energy India Limited | 1.99% | |
| ✔ Bharat Heavy Electricals Limited | 1.70% | |
| GE Vernova T&D India Limited | 0.86% | |
| Finance | 3.46% | |
| Cholamandalam Investment and Finance Company Ltd | 1.38% | |
| PNB Housing Finance Limited | 1.23% | |
| Power Finance Corporation Limited | 0.85% | |
| Petroleum Products | 3.39% | |
| ✔ Reliance Industries Limited | 3.39% | |
| Automobiles | 2.95% | |
| Mahindra & Mahindra Limited | 1.19% | |
| TVS Motor Company Limited | 0.95% | |
| Maruti Suzuki India Limited | 0.81% | |
| Chemicals & Petrochemicals | 2.95% | |
| Linde India Limited | 1.10% | |
| Navin Fluorine International Limited | 0.99% | |
| Vinati Organics Limited | 0.86% | |
| Pharmaceuticals & Biotechnology | 2.88% | |
| ✔ Divi's Laboratories Limited | 2.04% | |
| Cipla Limited | 0.84% | |
| Cement & Cement Products | 2.28% | |
| UltraTech Cement Limited | 1.35% | |
| Ambuja Cements Limited | 0.93% | |
| Beverages | 2.16% | |
| Varun Beverages Limited | 1.10% | |
| Radico Khaitan Limited | 1.06% | |
| Telecom - Services | 2.13% | |
| ✔ Bharti Airtel Limited | 2.13% | |
| Power | 1.90% | |
| NTPC Limited | 1.14% | |
| Power Grid Corporation of India Limited | 0.76% | |
| Retailing | 1.89% | |
| Eternal Limited | 1.09% | |
| Trent Limited | 0.80% | |
| Consumer Durables | 1.73% | |
| Havells India Limited | 0.92% | |
| Dixon Technologies (India) Limited | 0.81% | |
| Diversified FMCG | 1.37% | |
| ITC Limited | 1.37% | |
| Insurance | 1.15% | |
| Max Financial Services Limited | 1.15% | |
| Food Products | 1.11% | |
| Mrs. Bectors Food Specialities Limited | 1.11% | |
| Industrial Manufacturing | 1.11% | |
| Jyoti CNC Automation Ltd | 1.11% | |
| IT - Services | 1.05% | |
| Sagility India Limited | 1.05% | |
| Construction | 1.04% | |
| Larsen & Toubro Limited | 1.04% | |
| Healthcare Services | 1.00% | |
| Max Healthcare Institute Limited | 1.00% | |
| Industrial Products | 0.94% | |
| Cummins India Limited | 0.94% | |
| Financial Technology (Fintech) | 0.89% | |
| PB Fintech Limited | 0.89% | |
| Non - Ferrous Metals | 0.80% | |
| Hindalco Industries Limited | 0.80% | |
| Transport Infrastructure | 0.79% | |
| Adani Ports and Special Economic Zone Limited | 0.79% | |
| Personal Products | 0.77% | |
| Dabur India Limited | 0.77% | |
| LESS THAN 0.75% EXPOSURE | 5.23% | |
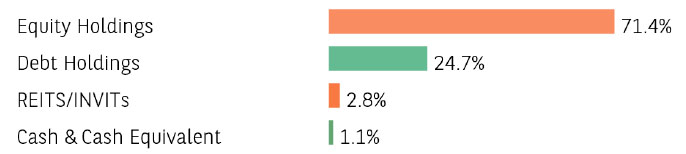
| TOTAL EQUITY HOLDING | 71.36% | |
| REITs/InvITs Holdings | % of Net Assets | |
| Anzen India Energy Yield PlusTrust | 2.84% | |
| Total REITs/InvITs Holdings | 2.84% | |
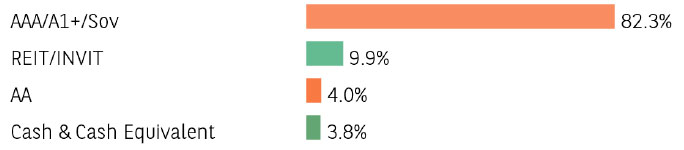
| FIXED INCOME HOLDINGS | Rating | % of Net Assets |
| GOVERNMENT BOND | 20.90% | |
| ✔7.34% GOI (MD 22/04/2064) | Sovereign | 18.19% |
| ✔6.79% GOI (MD 07/10/2034) | Sovereign | 2.71% |
| CORPORATE BOND | 3.81% | |
| Jamnagar Utilities & Power Private Limited | CRISIL AAA | 1.35% |
| NTPC Limited | CRISIL AAA | 1.32% |
| Piramal Finance Limited | ICRA AA | 1.14% |
| Total Fixed Income Holdings | 24.71% | |
| TREPS, Cash & Other Net Current Assets | 1.09% | |
| GRAND TOTAL | 100.00% |
Investment in Top 10 scrips constitutes 44.51% of the portfolio
The scheme currently does not have Distribution History.
| TER - Regular Plan (%) | 2.30% |
| TER - Direct Plan (%) | 0.47% |
| Portfolio Turnover Ratio | 0.83 |
* The information contained in this report has been obtained from sources considered to be authentic and reliable. The quantitative data does not
purport to be an offer for purchase and sale of mutual fund units.
| Average Maturity (years) | 28.46 |
| Modified Duration (years) | 10.40 |
| YTM (%) | 6.84% |
| Macaulay Duration† (years) | 10.77 |
†Concept of Macaulay duration: The Macaulay Duration is a measure of a bond’s sensitivity to interest rate changes. It is expressed in annual terms. It is the weighted average term to maturity of the cash flows from a bond. The weight of each cash flow is determined by dividing the present value of the cash flow by the price. Factors like a bond’s price, maturity, coupon, yield to maturity among others impact the calculation of Macaulay duration. The Macaulay duration can be viewed as the economic balance point of a group of cash flows. Another way to interpret the statistic is that it is the weighted average number of years an investor must maintain a position in the bond until the present value of the bond’s cash flows equals the amount paid for the bond. As it provides a way to estimate the effect of certain market changes on a bond’s price, the investor can choose an investment that will better meet his future cash needs.
➤ Capital appreciation and Income generation over long term.
➤ Investment in diversified portfolio of equity & equity related securities and fixed Income securities.
*Investors should consult their nancial advisers if in doubt about whether the product is suitable for them.
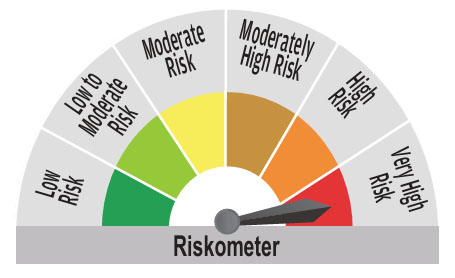
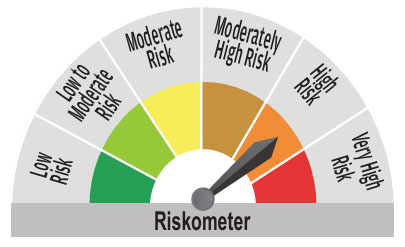
^^Riskometer For Scheme: basis it’s portfolio, ^Riskometer For Benchmark (CRISIL Hybrid 35+65 Aggressive Index): basis it’s constituents; As on May 30, 2025
For complete portfolio, kindly refer the website https://www.barodabnpparibasmf.in/
Mutual Fund investments are subject to market risks, read all scheme related documents carefully.