(An open-ended debt scheme investing in government
securities across maturity. A Relatively
High Interest Rate Risk and Low Credit Risk Scheme)
(An open-ended debt scheme investing in government
securities across maturity. A Relatively
High Interest Rate Risk and Low Credit Risk Scheme)

The primary objective of the Scheme is to generate income by investing in a portfolio of government securities. However, there can be no assurance that the investment objectives of the Scheme will be realized. The Scheme does not guarantee/indicate any returns.
 NAV Details (As on November 29, 2024)
| Regular Plan - Growth Option | : ₹ 40.5271 |
| Regular Plan - IDCW Option | : ₹ 24.0548 |
| Direct Plan - Growth Option | : ₹ 44.3871 |
| Direct Plan - IDCW Option | : ₹ 32.5837 |
 Benchmark Index (Tier 1)
CRISIL Dynamic Gilt Index
 Date of Allotment
March 21, 2002
 Fund Manager
 | Fund Manager | Managing fund since | Experience |
| Gurvinder Singh Wasan^ | 21-Oct-24 | 21 years |
| Prashant Pimple | 11-Jul-24 | 25 years |
^ Mr. Gurvinder Singh Wasan was appointed as Co Fund Manager w.e.f October 21, 2024 in place of Vikrant Pamnani.
 Load Structure
Entry Load
Exit Load: Nil
For detailed load structure please refer Scheme Information Document of the scheme.
Minimum Application Amount:
₹ 5,000 and in multiples of ₹ 1 thereafter.
Minimum Additional Application Amount:
₹ 1,000 and in multiples of ₹ 1 thereafter.
| Monthly AAUM## As on November 30, 2024 | : ₹ 1,678.28 Crores |
| AUM## As on November 30, 2024 | : ₹ 1,804.02 Crores |
## excluding inter-scheme Investments, if any, by other schemes of Baroda BNP Paribas Mutual Fund, as may be applicable
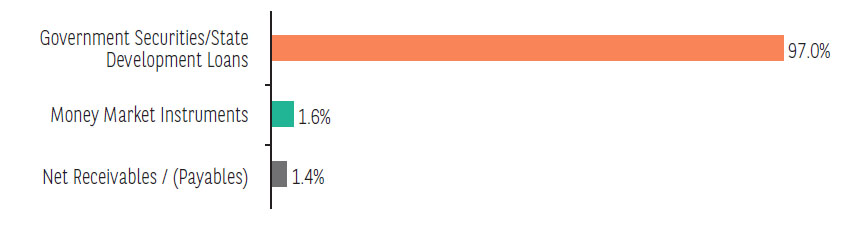
| FIXED INCOME HOLDINGS | Rating | % of Net Assets |
| GOVERNMENT BOND | 71.11% | |
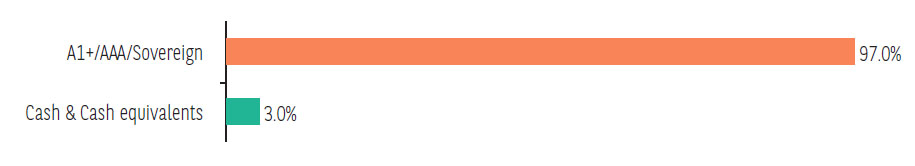
| ✔7.1% GOI (MD 08/04/2034) | Sovereign | 46.33% |
| ✔6.79% GOI (MD 07/10/2034) | Sovereign | 11.95% |
| ✔7.18% GOI (MD 14/08/2033) | Sovereign | 7.70% |
| ✔7.32% GOI (MD 13/11/2030) | Sovereign | 5.13% |
| STATE GOVERNMENT BOND | 25.92% | |
| ✔6.91% Maharashtra SDL (MD 15/09/2033) | Sovereign | 3.49% |
| ✔7.74% Karnataka SDL (MD 10/01/2036) | Sovereign | 3.18% |
| ✔7.72% Karnataka SDL (MD 06/12/2035) | Sovereign | 2.89% |
| ✔7.65% Gujarat SDL (MD 01/02/2033) | Sovereign | 2.85% |
| ✔7.74% Maharashtra SDL (MD 01/03/2033) | Sovereign | 2.58% |
| ✔7.81% Gujarat SDL (MD 12/10/2032) | Sovereign | 2.30% |
| 7.74% Karnataka SDL (MD 03/01/2034) | Sovereign | 2.01% |
| 7.47% Maharashtra SDL (MD 13/09/2034) | Sovereign | 1.98% |
| 7.46% Maharashtra SDL (MD 13/09/2033) | Sovereign | 1.41% |
| 7.43% Maharashtra SDL (MD 28/02/2035) | Sovereign | 1.41% |
| 7.22% Maharashtra SDL (MD 07/08/2034) | Sovereign | 1.23% |
| 7.46% Maharashtra SDL (MD 21/02/2035) | Sovereign | 0.57% |
| 8.05% Rajasthan SDL (MD 27/07/2037) | Sovereign | 0.02% |
| Total Fixed Income Holdings | 97.03% | |
| TREPS, Cash & Other Net Current Assets | 2.97% | |
| GRAND TOTAL | 100.00% |
Investment in Top 10 scrips constitutes 88.40% of the portfolio
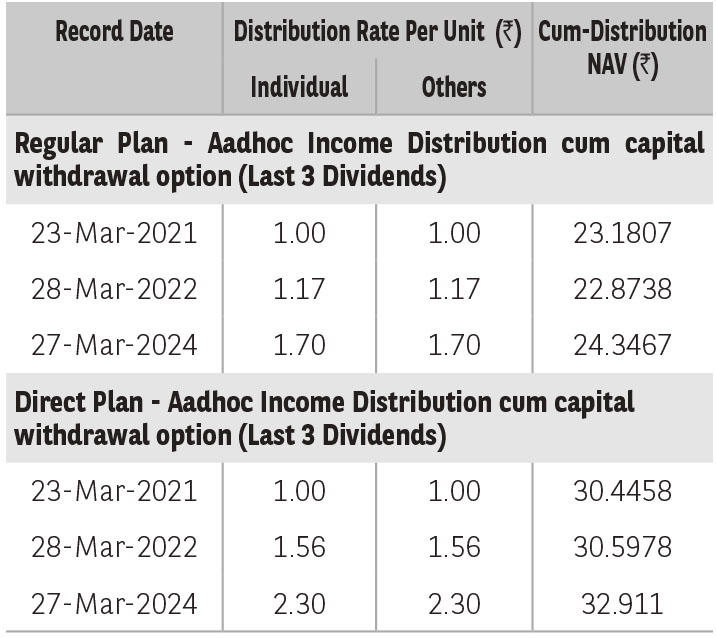
Pursuant to distribution under Income Distribution cum Capital Withdrawal (‘IDCW’) option, NAV of the IDCW option of the scheme(s) would fall to the extent of payout and statutory levy (if applicable). The
amounts under IDCW options can be distributed out of investors capital (Equalization Reserve), which is part of sale price that represents realized gains. Past performance may or may not be sustained in future.
The above stated distribution rate per unit is net distribution rate after deducting applicable taxes. The above distribution rates are on face value of ₹ 10 per unit.
| TER - Regular Plan (%) | 0.45% |
| TER - Direct Plan (%) | 0.14% |
| Average Maturity (years) | 9.04 |
| Modified Duration (years) | 6.46 |
| YTM (%) | 6.88% |
| Macaulay Duration† (years) | 6.68 |
* The information contained in this report has been obtained from sources considered to be authentic and reliable. The quantitative data does not
purport to be an offer for purchase and sale of mutual fund units.
†Concept of Macaulay duration: The Macaulay Duration is a
measure of a bond’s sensitivity to interest rate changes. It is
expressed in annual terms. It is the weighted average term to
maturity of the cash flows from a bond. The weight of each
cash flow is determined by dividing the present value of the
cash flow by the price. Factors like a bond’s price, maturity,
coupon, yield to maturity among others impact the calculation
of Macaulay duration. The Macaulay duration can be viewed as
the economic balance point of a group of cash flows. Another
way to interpret the statistic is that it is the weighted average
number of years an investor must maintain a position in the
bond until the present value of the bond’s cash flows equals
the amount paid for the bond. As it provides a way to estimate
the effect of certain market changes on a bond’s price, the
investor can choose an investment that will better meet his
future cash needs.
| Credit Risk (Max) → | Relatively Low Class A (CRV>=12) | Moderate: Class B (CRV>=10) | Relatively High: Class C (CRV<10) |
| Interest Rate Risk (Max) ↓ | |||
| Relatively Low: Class I (MD<=1 year) | |||
| Moderate: Class II (MD<=3 year) | |||
| Relatively High: Class III (Any MD) | A-III |
MD=Macaulay Duration, CRV=Credit Risk Value.
‡ The PRC matrix denotes the maximum risk that the respective Scheme can take i.e. maximum interest rate risk (measured
by MD of the Scheme) and maximum credit risk (measured by CRV of the Scheme)
➤ Credit risk free regular Income over long term.
➤ Investment only in Government (both Central and State Government) Securities.
*Investors should consult their financial advisers if in doubt about whether the product is suitable for them.
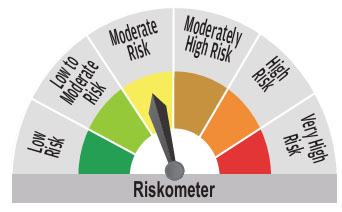
^^Riskometer For Scheme: basis it’s portfolio, ^Riskometer For Benchmark (CRISIL Dynamic Gilt Index): basis it’s constituents; As on November 30, 2024
Mutual Fund investments are subject to market risks, read all scheme related documents carefully.