
| |Baroda BNP Paribas Childrens Fund | |
(An open ended scheme for investment, for children having a lock-in of atleast 5 years or till the child attain the age of majority (whichever is earlier).)

| August 2026 |
|

|
• Long term capital appreciation and growth
• Investment in predominantly equity and equity related portfolio
Scheme Riskometer^^
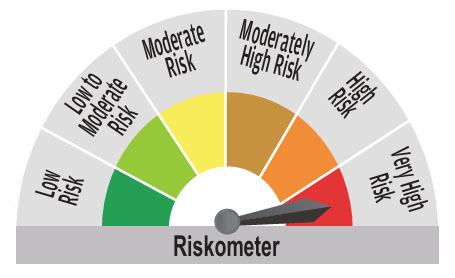 Investors understand that their
 principal will be at Very High risk.
Benchmark (Tier 1) Riskometer^
Benchmark riskometer is at Very High risk.
^^Riskometer For Scheme: basis it’s portfolio,
^Riskometer For Benchmark (Nifty 500 TRI):
basis it’s constituents; as on Aug 31, 2026
 Fund Details
| Date of allotment | : December 27, 2024 |
| Tier 1 Benchmark | : Nifty 500 TRI |
| NAV as on August 31, 2026: | |
| NAV/Unit | Regular Plan (In Rs.) | Direct Plan (In Rs.) |
| IDCW | 11.3955 | - |
| Growth | 11.3955 | 11.7484 |
| Monthly AUM as on Aug 31, 2026 (Rs. in Cr.) | : 129.68 |
| Monthly AAUM as on Aug 31, 2026 (Rs. in Cr.) | : 128.57 |
 Fund Manager And Experience
| Fund Manager | Total Experience | Managing Since |
| Ms. Silky Jain | 16 years | 01-Jul-26 |
| Mr. Yash Mehta | 1.5 years | 01-Jul-26 |
 Minimum Investment
Lumpsum Amount:
Rs.1000 and in multiples of Re.1 thereafter
Systematic Investment Plan (SIP) Amount:
(i) Daily, Weekly, Monthly SIP: Rs. 500/- and in
multiples of Re. 1/- thereafter; (ii) Quarterly SIP:
Rs. 1500/- and in multiples of Re. 1/- thereafter.
 Load Structure
Exit Load:
• If units of the Scheme are redeemed or
switched out within 1 year from the date of
allotment – 1% of the applicable NAV.
• If units of the Scheme are redeemed or switched out after 1
year from the date of allotment - Nil.
For detailed load structure please refer Scheme Information Document.
 Expense Ratio
| Regular | Direct | ||
| Total Expense Ratio (Weighted TER) | : | 2.47% | 1.09% |
| Base Expense Ratio (as on August 31, 2026) | : | 2.10% | 0.94% |
Market Capitalization
(% of Net Assets)| Large Cap | : | 54.71% |
| Mid Cap | : | 25.04% |
| Small Cap | : | 14.09% |
| Cash | : | 6.15% |
| Compounded Annualised Returns | Scheme Returns % Regular | Scheme Returns % Direct | Benchmark Returns % |
| Last 1 year | 9.48 | 11.37 | 5.31 |
| Last 3 years | N.A. | N.A. | N.A. |
| Last 5 years | N.A. | N.A. | N.A. |
| Since Inception | 8.10 | 10.09 | 3.73 |
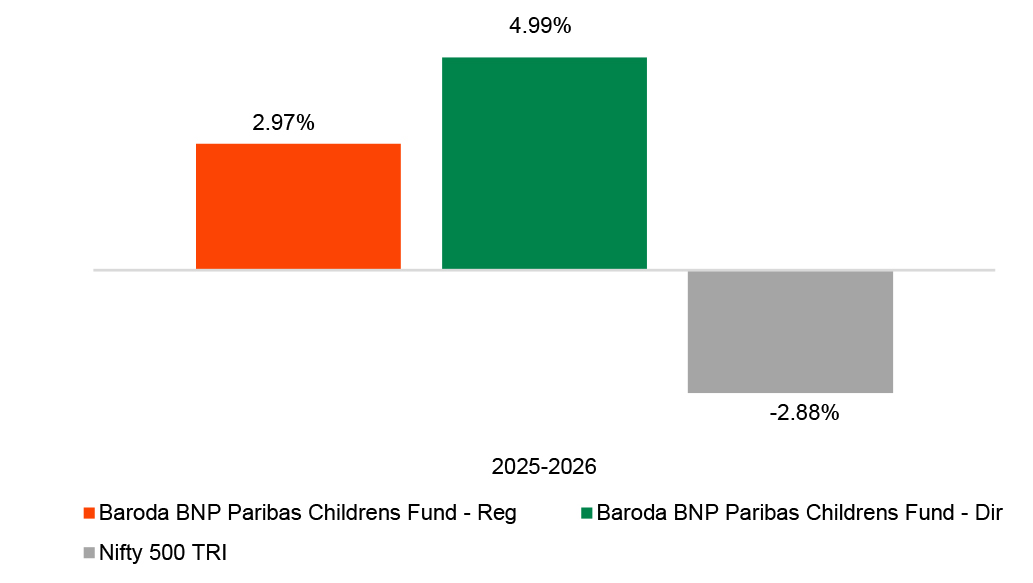
**Scheme Inception Date: 27-Dec-24. Past performance may or may not be sustained in
the future and does not guarantee future returns. Performance data is provided for the
Growth Option. Returns do not take into account load and taxes, if any, and different plans may
have a different expense structure. Returns for periods exceeding one year are compounded
annualised. Scheme performance is calculated based on the NAV as of the last day of the
month preceding the date of publication of this factsheet. Where the commencement or end
date of the relevant period falls on a non-business day, the NAV of the immediately preceding
business day has been considered for the purpose of return calculation. Exit load, if any,
has not been considered while computing performance.
Click here for the performance
of other schemes managed by the Fund Manager(s).
*Investors should consult their financial advisers if in doubt about whether the product is
suitable for them.
| Company / Issuer | % to Net Assets | |
| 1. | Reliance Industries Ltd | 2.95% |
| 2. | State Bank of India | 2.86% |
| 3. | Titan Company Limited | 2.75% |
| 4. | Navin Fluorine International Ltd | 2.61% |
| 5. | Larsen & Toubro Ltd | 2.42% |
| 6. | Karur Vysya Bank Ltd | 2.35% |
| 7. | Bajaj Finance Ltd | 2.32% |
| 8. | ICICI Bank Ltd | 2.24% |
| 9. | Multi Commodity Exchange of India Ltd | 2.23% |
| 10. | The Federal Bank Limited | 2.20% |
 |
for Detailed Investment in Securities |
| Portfolio Turnover Ratio (Annualized) | |
| a) Equity Turnover | 0.38 |
| b) Gross Exposure Turnover (%) | 0.38 |
| Average Maturity (yrs) | 1.79 |
| Macaulay Duration (yrs) | 1.44 |
| Modified Duration (yrs) | 1.39 |
| Annualized Portfolio Yield | 5.45% |
| Yield to Maturity (%) | 5.45% |
*Investors should consult their financial advisers if in doubt about whether the product is suitable for them.
 | Mandatory Scheme Lock-In Constraints | |
| | Market Risk (Volatility & Price Fluctuations) | |
| | Liquidity Risk | |
| | Credit and Counterparty Risk (Risk of Default) | |
| | Operational Risk (Risk of Trading or Backoffice or Administration Issues) |
| |
for Detailed Investment in Securities |
| |
for Allocation of Net Asset by Sectors |
| |
for Allocation of Net Asset by Asset Class |
| |
for Allocation of Net Assets by region/country |
Major Changes w.r.t previous month –
| Name of securities added | Name of securities deleted/reduced | Total Weightage in % |
| State Bank of India | 0.01% | |
| Titan Company Limited | 0.05% | |
| Navin Fluorine International Ltd | 0.27% | |
| Multi Commodity Exchange of India Ltd | 0.42% | |
| Reliance Industries Ltd | -0.16% | |
| Karur Vysya Bank Ltd | -0.03% | |
| Bajaj Finance Ltd | -0.26% | |
| ICICI Bank Ltd | -0.03% | |
| The Federal Bank Limited | -0.07% | |
| Bharti Airtel Ltd | -0.24% |
| Change in | July 2026 | Aug 2026 |
| Regular | 2.47% | 2.47% |
| Direct | 1.08% | 1.09% |
No change
| Sr. No. | Important Weblinks | |
| 1 | Video Explainer | Click here for a video providing simplified explanation of the Fund Factsheet |
| 2 | Calculation/Methodology | Click here for various mathematical parameters and their respective calculation methodology/formulae |
| 3 | Detailed Risk Factors | Click here for various risk factors associated with the Scheme. |
| 4 | Scheme Information Document (SID) | Click here/Scan QR code for SID on the website  |
| 5 | Investor Services | Click here for contact details for investor services. |
| 6 | Grievance submission and redressal | Click here to be directed to the grievance submission page. |
Additional Disclosure
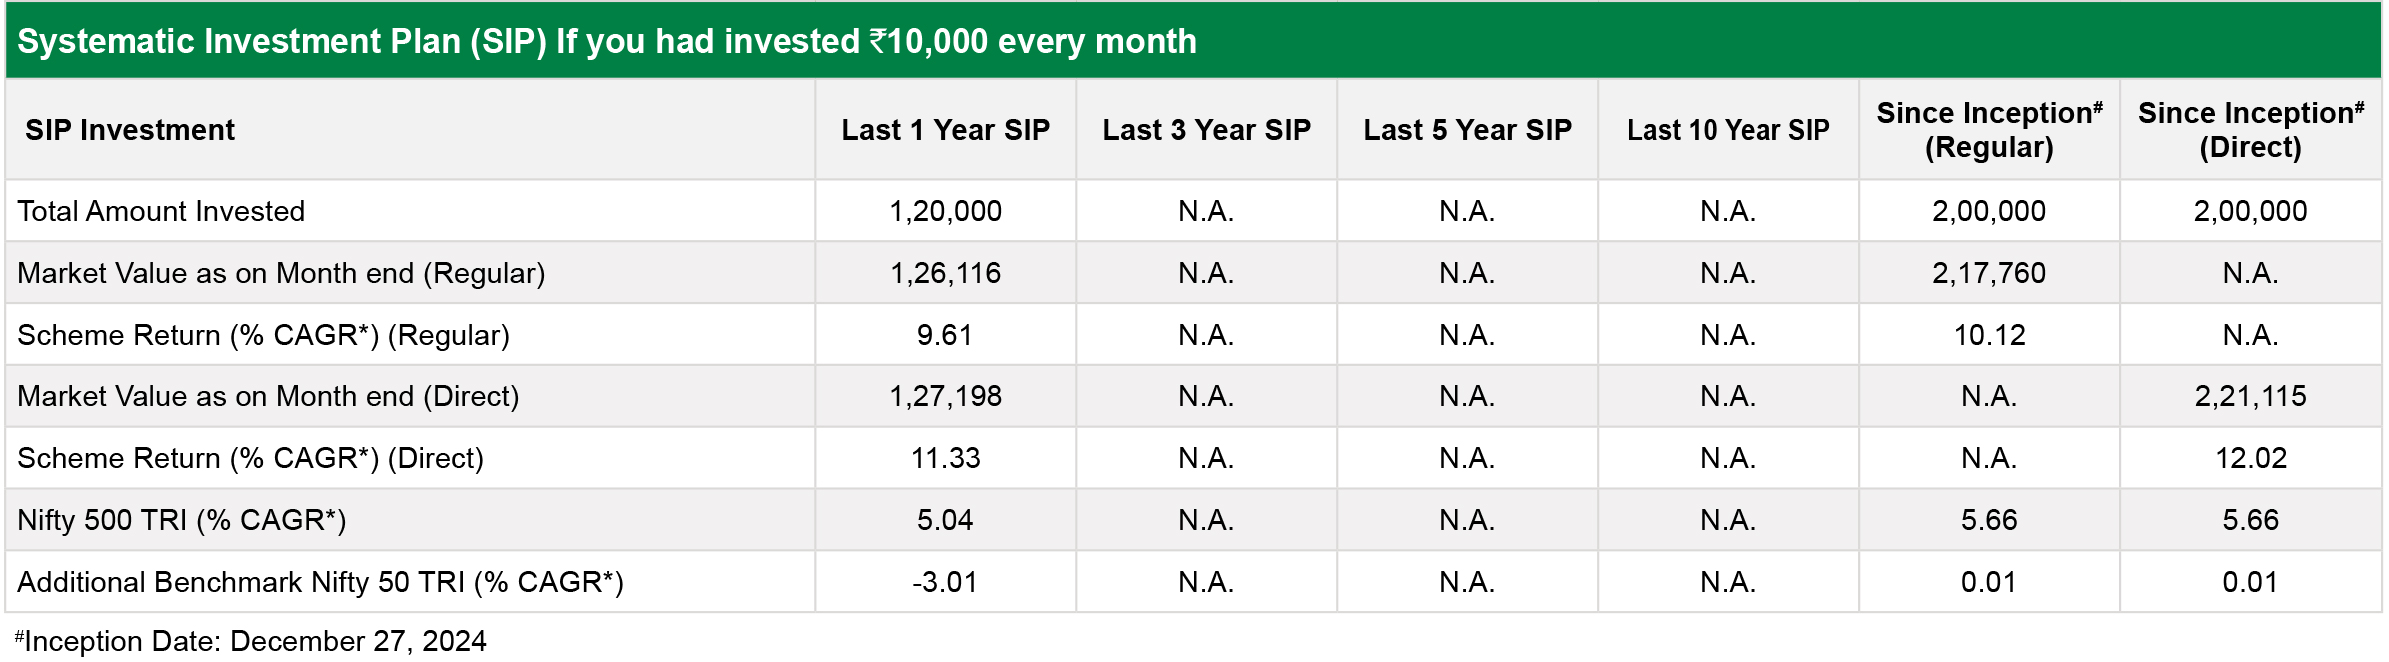
Past performance may or may not be sustained in future and is not a guarantee of future returns. Returns do not take into account the load and taxes, if any. Different plans shall have a different expense structure. The above data assumes investments in Growth option for distributor/regular plan. Where returns are not available for a particular period, they have not been shown. *% CAGR Returns are computed after accounting for the cash flow by using the XIRR method. For further details on performance of the scheme and performance of other schemes managed by the Fund Manager, please refer to “Performance of Schemes”. Please note TRI indicates Total Return Index.
Past Performance is not an indicator or guarantee of future results
Mutual Fund investments are subject to market risks, read all scheme related documents carefully.