AUM
₹ 281.85 Crores
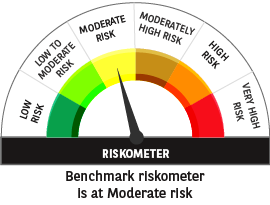
Benchmark
*Investors should consult their financial advisers if in doubt about whether the product is suitable for them
NIFTY Equity Savings Index TRI
Inception Date
25-07-2019
Expense Ratio (Base)
2.25%
As on 27-03-2026
Market Capitalization as per SEBI - Large Cap: 1st - 100th company, Mid Cap: 101st - 250th company and Small Cap: 251st company onwards in terms of full market capitalization
% of net assets of top 5 sectors includes equity less than 0.75% of corpus
Equity Holdings
Debt Holdings
Cash & Cash equivalents
REITs/InvITs
Derivatives
A1+/AAA/Sovereign: 77.90
AA+: 13.40
Cash & Cash equivalents: 7.40
AA: 1.40
Historical, annualized average returns, useful for examining the behaviour of returns for a given holding period. For eg: Rolling returns for 5 years are calculated by checking all 5 year time periods across a fund’s history and calculating average/ minimum/ maximum values.
Bars show Return distribution (% of times) in a given range for a selected time period.

1 year |
3 years |
5 years |
Since inception |
|
|---|---|---|---|---|
| Regular Plan (% CAGR*) | 10.78% | 10.27% | 7.82% | 8.32% |
| Direct Plan (% CAGR*) | 12.04% | 11.49% | 9.01% | 9.51% |
| NIFTY Equity Savings Index TRI (% CAGR*) | 10.27% | 10.32% | 8.88% | 9.48% |
| Additional Benchmark CRISIL 10 Year Gilt Index (% CAGR*) | 5.60% | 8.02% | 5.54% | 5.51% |
| Value of ₹10,000 Invested In | 1 year |
3 years |
5 years |
Since inception |
|---|---|---|---|---|
| Regular Plan | 11068.38 | 13409.92 | 14577.34 | 16950.00 |
| Direct Plan | 11193.40 | 13858.67 | 15397.59 | 18211.10 |
| NIFTY Equity Savings Index TRI | 11017.84 | 13424.98 | 15306.55 | 18181.91 |
| Additional Benchmark CRISIL 10 Year Gilt Index | 10555.25 | 12603.97 | 13095.62 | 14251.32 |
Past performance may or may not be sustained in future and is not a guarantee of any future returns. Returns do not take into account the load, if any. Returns are for growth option. Different plans shall have a different expense structure. The performance details provided above are for regular/distributor plan.
Please refer below for fund manager details and performance of other funds managed by the Fund Manager(s)
*Compound annual growth rate
**Benchmark & ***Additional Benchmark
Data As on 28th February 2026 or specified otherwise.
1 YRS CAGR |
3 YRS CAGR |
5 YRS CAGR |
Since Inception |
|
|---|---|---|---|---|
| Scheme Return (% CAGR*) (Regular) | 5.15% | 7.78% | 8.20% | 8.28% |
| Nifty Equity Savings TRI (% CAGR*) | 6.16% | 8.29% | 8.61% | 9.25% |
| Scheme Return (% CAGR*) (Direct) | 6.34% | 9.01% | 9.40% | 9.47% |
| Value of ₹10,000 Invested In | 1 YRS |
3 YRS |
5 YRS |
Since Inception |
|---|---|---|---|---|
| Amount Invested (Regular) | 120,000.00 | 360,000.00 | 600,000.00 | 800,000.00 |
| Market Value At Month End (Regular) | 123,265.00 | 404,682.00 | 737,341.00 | 1,057,925.00 |
| Amount Invested (Direct) | 120,000.00 | 360,000.00 | 600,000.00 | 800,000.00 |
| Market Value At Month End (Direct) | 124,017.00 | 412,046.00 | 759,834.00 | 1,101,579.00 |
Past performance may or may not be sustained in future and is not a guarantee of any future returns. Returns do not take into account the load, if any. Returns are for growth option. Different plans shall have a different expense structure. The performance details provided above are for regular/distributor plan.
Please refer below for fund manager details and performance of other funds managed by the Fund Manager(s)
*Compound annual growth rate
Data As on 2026-02-27 specified otherwise.
This calculator is provided for informational purposes only.
The results are based on user inputs and should not be considered as investment advice. Users should seek the advice of a qualified financial professional before making any investment decisions.
The creators of the calculator and its affiliates shall not be held responsible for any financial losses resulting from the use of the calculator.
Past performance may or may not be sustained in the future and should not be used as a basis for comparison with other investments. Mutual Fund Investments are subject to market risks, read all scheme related documents carefully.
SIP is allowed in select open ended schemes. Refer the Scheme SAI, SID, KIM for detailed information

Fund BARODA BNP PARIBAS ELSS Tax Saver Fund - Regular - Growth Option
Frequency Monthly
SIP Start Date 05-01-2006
SIP End Date 01-01-2025
Invested Amount ₹22,80,000.00
Current Value ₹1,03,86,141.98
Scheme Returns 14.17%
Benchmark Returns 14.12%
TER (Total Expense Ratio) 2.2%
This calculator is provided for informational purposes only.
The results are based on user inputs and should not be considered as investment advice. Users should seek the advice of a qualified financial professional before making any investment decisions.
The creators of the calculator and its affiliates shall not be held responsible for any financial losses resulting from the use of the calculator.
Past performance may or may not be sustained in the future and should not be used as a basis for comparison with other investments. Mutual Fund Investments are subject to market risks, read all scheme related documents carefully.
SIP is allowed in select open ended schemes. Refer the Scheme SAI, SID, KIM for detailed information
The primary objective of the Scheme is to generate capital appreciation and income by using arbitrage opportunities, investment in equity / equity related instruments and debt/money market instruments. However, there can be no assurance that the investment objectives of the Scheme will be achieved. The Scheme does not guarantee/indicate any returns.
Entry Load : Not Applicable
Exit Load: · If units are redeemed upto 10% of the units held, on or before one year from the date of allotment : Nil
· If units are redeemed over and above the 10% limit, on or before one year from the date of allotment : 1% of the applicable Net Asset Value (NAV)
? If units are redeemed after one year from the date of allotment: Nil
. No exit load will be charged for Income Distribution cum capital withdrawal option reinvestment units
. Transaction charges, if applicable, shall be deducted. The above mentioned load structure is also applicable to SIP investments. For detailed load structure please refer Scheme Information Document.
Lumpsum Details:
Minimum Application Amount: ₹ 5,000 and in multiples of ₹ 1 thereafter.
Minimum Additional Application Amount: ₹ 1,000 and in multiple of ₹ 1 thereafter
(i) Daily, Weekly, Monthly SIP: ₹ 500/- and in multiples of ₹ 1/- thereafter;
(ii) Quarterly SIP: ₹ 1500/- and in multiples of ₹ 1/- thereafter. There is no upper limit
₹ 1000/Installment - 6 Installments - Frequency - Daily/Weekly/Fortnightly/Monthly/
₹ 1500/Installment - 4 Installments - Frequency - Quarterly
Withdrawal must be for a minimum amount of ₹ 1,000/- or in multiples of Re.1/- thereafter, in Weekly / Monthly SWP and ₹ 1,500/- and in multiples of Re.1/- thereafter, in Quarterly SWP.
An open ended scheme investing in equity, arbitrage and debt instruments.
This product is suitable for investors who are seeking*:
- Long term capital appreciation and income
generation.
- Investment in equity and equity related securities, arbitrage opportunities, and debt and money
market instruments.

^^Riskometer For Scheme: basis it's portfolio, ^Riskometer For Benchmark (NIFTY Equity Savings Index TRI): basis it's constituents; as on February 28, 2026
*Investors should consult their financial advisers if in doubt about whether the product is suitable for them.

Pratish Krishnan
Fund Manager & Senior Analyst
Managing this fund since September 2019
Performance of Other Funds Managed by Pratish Krishnan
Neeraj Saxena
Fund Manager & Dealer - Equity
Managing this fund since October 2024
Performance of Other Funds Managed by Neeraj Saxena
Gurvinder Singh Wasan
CFA, Fund Manager
Managing this fund since October 2024
Performance of Other Funds Managed by Gurvinder Singh Wasan
Ankeet Pandya
Research Analyst
Managing this fund since January 2025
Performance of Other Funds Managed by Ankeet Pandya
An open ended scheme investing in equity, arbitrage and debt instruments.
Hybrid
₹ 16.4226
NAV as on 27-03-2026
*Investors should consult their financial advisers if in doubt about whether the product is suitable for them

8.32 %
Returns lumpsum
8.28%
Returns SIP
| Schemes (Benchmark Index) | 1 Year CAGR | 3 Year CAGR | 5 Year CAGR | |||
|---|---|---|---|---|---|---|
| Scheme Returns | Benchmark Returns | Scheme Returns | Benchmark Returns | Scheme Returns | Benchmark Returns | |
| Baroda BNP Paribas Aggressive Hybrid Fund (CRISIL Hybrid 35+65 - Aggressive Index) | 3.52% | 12.92% | 13.66% | 7.67% | 15.25% | 12.50% |
| Baroda BNP Paribas Balanced Advantage Fund (NIFTY 50 Hybrid Composite Debt 50:50 Index) | 7.65% | 14.15% | 13.98% | 8.39% | 13.32% | 10.41% |
| Baroda BNP Paribas Childrens Fund (Nifty 500 TRI) | 18.90% | 13.53% | N.A.* | 11.31% | N.A.* | 6.58% |
| Baroda BNP Paribas Conservative Hybrid Fund (CRISIL Hybrid 85+15 - Conservative Index) | 6.03% | 7.28% | 8.47% | 7.30% | 7.41% | 8.90% |
| Baroda BNP Paribas ELSS Tax Saver Fund (Nifty 500 TRI) | 5.59% | 11.96% | 18.71% | 6.58% | 17.96% | 15.61% |
| Baroda BNP Paribas Equity Savings Fund (NIFTY Equity Savings Index TRI) | 7.29% | 8.88% | 10.10% | 8.74% | 8.50% | 9.78% |
| Baroda BNP Paribas India Consumption Fund (NIFTY India Consumption TRI) | 0.99% | 17.57% | 15.59% | 10.05% | 17.82% | 17.50% |
| Baroda BNP Paribas Innovation Fund (Nifty 500 TRI) | 2.73% | 15.67% | N.A.* | 6.58% | N.A.* | 15.61% |
| Baroda BNP Paribas Mid Cap Fund (Nifty Midcap 150 TRI) | 4.40% | 12.79% | 20.15% | 7.77% | 22.58% | 23.57% |
| Baroda BNP Paribas Multi Asset Active FOF (60% of Nifty Composite Debt Index + 20% of Nifty 500 TRI + 20% of INR Prices of Gold) | 16.13% | 16.13% | N.A.* | 15.15% | N.A.* | N.A.* |
| Baroda BNP Paribas Multi Asset Fund (65% of Nifty 500 TRI + 20% of NIFTY Composite Debt Index + 15% of INR Price of Gold ) | 11.45% | 16.99% | N.A.* | 14.25% | N.A.* | N.A.* |
| Baroda BNP Paribas Retirement Fund (CRISIL Hybrid 35+65 - Aggressive Index) | 6.54% | 10.48% | N.A.* | 7.67% | N.A.* | 12.50% |
Period for which scheme's performance has been provided is computed basis last day of the month-end preceding the date of advertisement.
Past performance may or may not be sustained in future and should not be used as a basis of comparison with other investments. Returns do not take into account the load, if any. Returns are for growth option. Different plans shall have a different expense structure. The performance details provided above are for regular/distributor plan.
For Fund Manager(s) & Managing Since Details click here
*Where returns are not available for that particular period, they have not been shown.
| Schemes (Benchmark Index) | 1 Year CAGR | 3 Year CAGR | 5 Year CAGR | |||
|---|---|---|---|---|---|---|
| Scheme Returns | Benchmark Returns | Scheme Returns | Benchmark Returns | Scheme Returns | Benchmark Returns | |
| Baroda BNP Paribas Arbitrage Fund (Nifty 50 Arbitrage Index) | 6.17% | 5.72% | 6.97% | 7.58% | 5.60% | 7.65% |
| Baroda BNP Paribas Balanced Advantage Fund (NIFTY 50 Hybrid Composite Debt 50:50 Index) | 7.65% | 14.15% | 13.98% | 8.39% | 13.32% | 10.41% |
| Baroda BNP Paribas Equity Savings Fund (NIFTY Equity Savings Index TRI) | 7.29% | 8.88% | 10.10% | 8.74% | 8.50% | 9.78% |
| Baroda BNP Paribas NIFTY 200 Momentum 30 INDEX Fund (Nifty 200 Momentum 30 Total Return Index) | -7.15% | -13.74% | N.A.* | -5.56% | N.A.* | 17.60% |
| Baroda BNP Paribas NIFTY 50 INDEX Fund (Nifty 50 TR Index) | 9.11% | 11.47% | N.A.* | 9.97% | N.A.* | 13.11% |
| Baroda BNP Paribas NIFTY BANK ETF (Nifty Bank Total Returns Index) | 15.48% | 12.79% | N.A.* | 15.75% | N.A.* | N.A.* |
| Baroda BNP Paribas NIFTY Midcap 150 INDEX Fund (Nifty Midcap 150 Total Returns Index) | 6.48% | 6.69% | N.A.* | 7.77% | N.A.* | 23.57% |
Period for which scheme's performance has been provided is computed basis last day of the month-end preceding the date of advertisement.
Past performance may or may not be sustained in future and should not be used as a basis of comparison with other investments. Returns do not take into account the load, if any. Returns are for growth option. Different plans shall have a different expense structure. The performance details provided above are for regular/distributor plan.
For Fund Manager(s) & Managing Since Details click here
*Where returns are not available for that particular period, they have not been shown.
| Schemes (Benchmark Index) | 1 Year CAGR | 3 Year CAGR | 5 Year CAGR | |||
|---|---|---|---|---|---|---|
| Scheme Returns | Benchmark Returns | Scheme Returns | Benchmark Returns | Scheme Returns | Benchmark Returns | |
| Baroda BNP Paribas Aggressive Hybrid Fund (CRISIL Hybrid 35+65 - Aggressive Index) | 3.52% | 12.92% | 13.66% | 7.67% | 15.25% | 12.50% |
| Baroda BNP Paribas Balanced Advantage Fund (NIFTY 50 Hybrid Composite Debt 50:50 Index) | 7.65% | 14.15% | 13.98% | 8.39% | 13.32% | 10.41% |
| Baroda BNP Paribas Conservative Hybrid Fund (CRISIL Hybrid 85+15 - Conservative Index) | 6.03% | 7.28% | 8.47% | 7.30% | 7.41% | 8.90% |
| Baroda BNP Paribas Corporate Bond Fund (CRISIL Corporate Debt A-II Index) | 8.91% | 6.92% | 8.03% | 8.24% | 5.51% | 7.71% |
| Baroda BNP Paribas Credit Risk Fund (CRISIL Credit Risk Debt B-II Index) | 8.31% | 7.92% | 7.92% | 9.10% | 9.48% | 8.60% |
| Baroda BNP Paribas Dynamic Bond Fund (CRISIL Dynamic Bond Debt A-III Index) | 4.57% | 7.39% | 6.59% | 7.09% | 4.99% | 7.69% |
| Baroda BNP Paribas Equity Savings Fund (NIFTY Equity Savings Index TRI) | 7.29% | 8.88% | 10.10% | 8.74% | 8.50% | 9.78% |
| Baroda BNP Paribas GILT Fund (CRISIL Dynamic Gilt Index) | 5.85% | 6.33% | 7.51% | 6.68% | 5.14% | 8.03% |
| Baroda BNP Paribas GOLD ETF (Domestic Price of Gold) | 62.42% | 42.70% | N.A.* | 65.19% | N.A.* | N.A.* |
| Baroda BNP Paribas Liquid Fund (CRISIL Liquid Debt A-I Index) | 6.52% | 6.92% | 6.93% | 6.50% | 5.73% | 6.96% |
| Baroda BNP Paribas Low Duration Fund (CRISIL Low Duration Debt A-I Index) | 7.09% | 7.28% | 6.91% | 7.46% | 5.51% | 7.48% |
| Baroda BNP Paribas Money Market Fund (CRISIL Money Market A-I Index) | 7.47% | 5.55% | 7.23% | 6.87% | 5.67% | 7.24% |
| Baroda BNP Paribas Multi Asset Active FOF (60% of Nifty Composite Debt Index + 20% of Nifty 500 TRI + 20% of INR Prices of Gold) | 16.13% | 16.13% | N.A.* | 15.15% | N.A.* | N.A.* |
| Baroda BNP Paribas NIFTY SDL December 2026 INDEX Fund (NIFTY SDL December 2026 Index) | 7.67% | 7.45% | N.A.* | 8.16% | N.A.* | N.A.* |
| Baroda BNP Paribas NIFTY SDL December 2028 INDEX Fund (NIFTY SDL DECEMBER 2028 INDEX) | 8.18% | 8.25% | N.A.* | 8.80% | N.A.* | N.A.* |
| Baroda BNP Paribas Overnight Fund (CRISIL Liquid Overnight Index) | 5.87% | 5.04% | 6.36% | 5.94% | 5.31% | 6.47% |
| Baroda BNP Paribas Retirement Fund (CRISIL Hybrid 35+65 - Aggressive Index) | 6.54% | 10.48% | N.A.* | 7.67% | N.A.* | 12.50% |
| Baroda BNP Paribas Short Duration Fund (CRISIL Short Duration Debt A-II Index) | 7.96% | 7.47% | 7.50% | 8.20% | 5.77% | 7.73% |
| Baroda BNP Paribas Ultra Short Duration Fund (CRISIL Ultra Short Duration Debt A-I Index) | 7.16% | 6.31% | 7.28% | 7.03% | 6.01% | 7.38% |
Period for which scheme's performance has been provided is computed basis last day of the month-end preceding the date of advertisement.
Past performance may or may not be sustained in future and should not be used as a basis of comparison with other investments. Returns do not take into account the load, if any. Returns are for growth option. Different plans shall have a different expense structure. The performance details provided above are for regular/distributor plan.
For Fund Manager(s) & Managing Since Details click here
*Where returns are not available for that particular period, they have not been shown.
| Schemes (Benchmark Index) | 1 Year CAGR | 3 Year CAGR | 5 Year CAGR | |||
|---|---|---|---|---|---|---|
| Scheme Returns | Benchmark Returns | Scheme Returns | Benchmark Returns | Scheme Returns | Benchmark Returns | |
| Baroda BNP Paribas Childrens Fund (Nifty 500 TRI) | 18.90% | 13.53% | N.A.* | 11.31% | N.A.* | 6.58% |
| Baroda BNP Paribas Conservative Hybrid Fund (CRISIL Hybrid 85+15 - Conservative Index) | 6.03% | 7.28% | 8.47% | 7.30% | 7.41% | 8.90% |
| Baroda BNP Paribas Equity Savings Fund (NIFTY Equity Savings Index TRI) | 7.29% | 8.88% | 10.10% | 8.74% | 8.50% | 9.78% |
| Baroda BNP Paribas Innovation Fund (Nifty 500 TRI) | 2.73% | 15.67% | N.A.* | 6.58% | N.A.* | 15.61% |
| Baroda BNP Paribas Retirement Fund (CRISIL Hybrid 35+65 - Aggressive Index) | 6.54% | 10.48% | N.A.* | 7.67% | N.A.* | 12.50% |
Period for which scheme's performance has been provided is computed basis last day of the month-end preceding the date of advertisement.
Past performance may or may not be sustained in future and should not be used as a basis of comparison with other investments. Returns do not take into account the load, if any. Returns are for growth option. Different plans shall have a different expense structure. The performance details provided above are for regular/distributor plan.
For Fund Manager(s) & Managing Since Details click here
*Where returns are not available for that particular period, they have not been shown.
© Copyright Baroda BNP Paribas Mutual Fund
